Download
1 / 26
270 likes | 415 Vues
Release properties of Pharmaceutical tablets studied by FTIR imaging. Jaap van der Weerd. Imperial College London. Outline. -Tablet dissolution. -FTIR imaging. -Validation, large area imaging. -Application for a poorly soluble drug. Water uptake &. gel formation. Erosion &.

E N D
Release properties of Pharmaceutical tablets studied by FTIR imaging Jaap van der Weerd Imperial College London
Outline -Tablet dissolution -FTIR imaging -Validation, large area imaging -Application for a poorly soluble drug
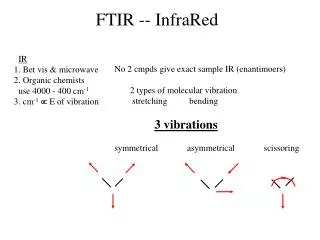
Water uptake & gel formation Erosion & Diffusion & dissolution dissolution of the tablet of drug (e.g. paracetamol)
Dissolution test Measures amount of drug in solution -simulates 'in vivo' well -easy -worldwide standard But: No info on mechanism Many experiments needed meter tablet
Turning Mirror MCT camera Mid-IR source H2O Step-scan mirror Beamsplitter Fixed mirror Infrared Imaging
- Infrared spectra – chemically very specific 1045 1 1390 1671 0.8 1612 3421 2901 1022 0.6 HPMC Absorbacne 3348 0.4 2777 3144 niacinamide 1617 1057 0.2 1396 1200 3353 1666 3206 wet mixture 0 3500 3000 2500 2000 1500 1000 Wavenumber / cm -1
ATR imaging attenuated total reflectance transmission requires very thin tablets (~10 µm)
Time HPMC Drug Water dry t=0 t=40 t=80 t=160 t=190 Water flow starts
anvil punch IR lightpath anvil punch UV detector Water 260 nm supply A 0.123 waste IR lightpath Compaction cell
Validation What if there’s a gap between tablet and ATR?
Pressed at 120 cNm Water 0.4 0.2 Tablet 0 3500 3000 2500 2000 1500 1000 Pressed at 80 cNm Water 0.4 Absorbance 0.2 0 Tablet 3500 3000 2500 2000 1500 1000 0.06 Pressed at 10 cNm 0.04 Water 0.02 0 3500 3000 2500 2000 1500 1000 Tablet -1 Wavenumber / cm 1
2 But what if … water leaks under tablet?
How to evaluate leakage? Water tablet radius Gel Core Time Water 35% HPMC tablet radius Core distance / µm 65% HPMC 120 160 80 40 Time / minutes
Results J. Van der Weerd and S. Kazarian, Validation of macroscopic ATR-FTIR imaging to study dissolution of swelling pharmaceutical tablets, Appl. Spectrosc. 58 (2004) 1413-1419.
In short Leaking does occur in HPMC tablets Next steps Apply multivariate processing Measurements on softer crystal possible! E.g. ZnSe with a FOV of ~ (diamond ~) Fields of view Tablet ZnSe diamond 1 mm2 20 mm2
Analysis on ZnSe crystal t = 0 t = 10 t = 45 t = 136 t = 250 HPMC 1 mm Water Water 1 mm 0 weight fraction 1
10% HPMC 3 2.5 20% HPMC 2 Radius / mm 1.5 1 40% HPMC 0.5 80% HPMC 60% HPMC Time / min 0 100 200 300 Water intake: 3.95 µm / minute
P1 F P2 D cell F3 F1 F2 Diclofenac: a poorly soluble drug
Dissolution test pH11 soluble pH4 poorly soluble 0.6 0.2 0.1 0.2 Absorbance Absorbance 1 2 3 4 5 6 1 2 3 4 5 6 time / hours time / hours 1 0.8 pH4/11 Integrated profiles 0.8 pH11 0.4 0.6 M(t) / M( ) pH4/11 0.4 1 2 3 4 5 6 pH4 time / hours 0.2 0 1 2 3 4 5 time / hours
time (HPMC) time (Drug) Time time (Water) Multivariate analysis pls cls
Results of CLS NaDF wetDF HDF 1 CM HPMC HPMC gel water 1 CM
Further data-reduction: system has radial symmetry conc. average concentration radius total # of pixels in FOV nop radius
Radius of the tablet 4 4 4 .6 .3 1 HPMC Diclofenac Water 4 4 4 .8 3 3 3 3 3 3 .4 .2 time / hours .6 time / h 2 2 2 2 2 2 .4 .2 .1 1 1 1 1 1 1 .2 0 0 0 1 2 3 1 2 3 1 2 3 radius / mm radius / mm radius / mm
Calculated release profiles 1 .8 .6 .4 pH 4 .2 pH 11 pH 4 / 11 Calculated drug release M(t)/ M 0 1 2 3 4 5 6
Conclusions • Imaging combined with flow-through dissolution test demonstrated • multivariate analysis of a dynamic system and chemometric processing shown • Leaking does not occur for HPMC • Great potential to study poorly soluble drugs (unlike the dissolution test)
Thanks to Sergei G. Kazarian, Supervisor Colleagues at Imperial College London EPSRC & Royal Academy of Engineering –Grants Questions?