Download
1 / 19
190 likes | 222 Vues
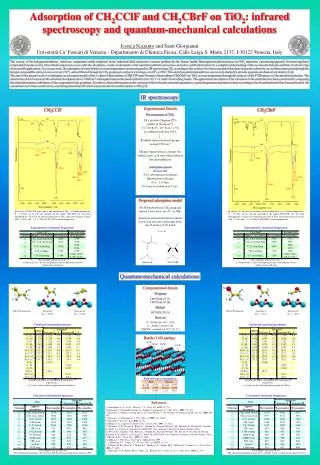
IR-Spectroscopy. Introduction Theory Instrumentation Sample preparation Table and charts. Introduction. Vibrational spectrocopy Spectral area : 4000 – 400 cm -1 Wave number: ν̃ = 1/ λ Even simple molecules can give complex spectra.

E N D
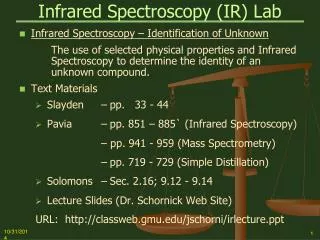
IR-Spectroscopy Introduction Theory Instrumentation Sample preparation Table and charts
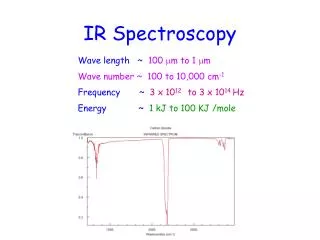
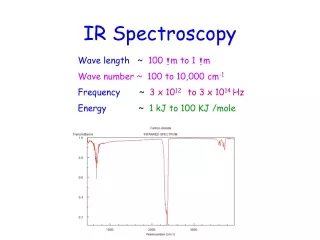
Introduction Vibrational spectrocopy Spectral area : 4000 – 400 cm-1 Wave number: ν̃= 1/λ Even simple molecules can give complex spectra. Advantage: identification when authentic sample is known. Large databases available for comparison. Unknown sample: Analysis of functional groups. Functional groups have characteristic absorptions in an IR-spectrum.
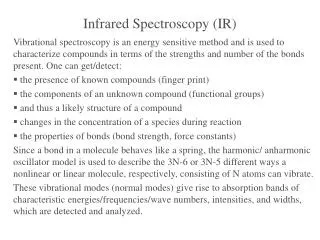
Theory IR-radiation is absorped by organic molecules and converted to molecular vibrational energy. This absorption is quantized, but for every vibrational energy change, there are many rotational energy changes resulting in band spectra. Harmonic oscillator r(t) = r0 + Asin(2πνt)
The absorption frequency is dependent on the relative mass of the atoms, the force constant of the chemical bonds and the geometry of the atoms. The frequency can be approximated: Force constant Reduced mass
Force constants Approximation: the value of the force constant doubles from a single bond to a double bond and increases three times from a single to a triple bond.
The intensity is reported in semi quantitative termes: vs = very strong s = strong, m = medium, w = weak
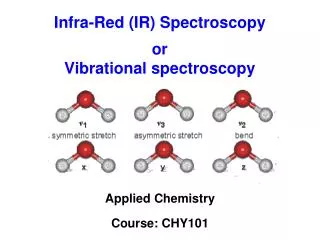
Two types of molecular vibrations: bending and stretching Stretch: rythmic motion along the binding axis Bend: Change in the bonding- angle
Selection rules • Absorption of electromagnetic radiation when ν(IR) = ν(vib) • When the dipole moment fluctuates within a vibrational periode. Consequence: Symmetrical molecules are IR-inactive for symmetrical stretching frequencies. No change in dipole moment. For instance: H2 og CO2
Degrees of freedom A non linear molecule with n atoms have 3n – 6 delocalized vibrational modes. The theoretical number of fundamental vibrational frequencies will rarely be observed. It’s often a good approximation to use localized vibrations. Conequence: The frequency νgives a fingerprint of functional groups. Even though the IR-spectrum is a function of the whole molecule, functional groups will give absorption bands with almost the same frequency independent of the structure of the rest of the molecule.
Overtones and combination tones Overtones occur as multiples of a given frequency ν= nνfund It’s common with only one overtone (n = 2) for strong abs. because the intensitiy drops off rapidly f.eks. C=O strekk (3400) Combinations bands occur at frequencies which are the sum of two other vibrational frequencies. ν = ν1fund + ν2fund
”Characteristic frequencies should be recognized C=O stretch (ca. 1740) and weak overtone (ca 3480) ca. 2850 – 3000, 1465, 1150- 1350 for C-H
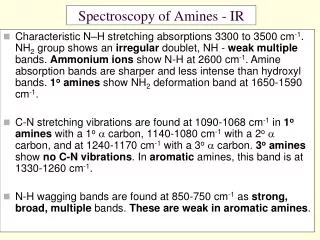
Hydrogen bonding Hydrogen bonding can occur in a system with a proton donor (X-H) and a proton acceptor Y:. X og Y: are electronegative elements and Y: has an available free elektron pair. Common proton donors: carboxyl, hydroxyl, amine, amide. Common acceptor atoms: oxygen, nitrogen og halogens. Hydrogen bonding changes the force constant to both the donor and the acceptor. X-H stretch moves towards lower frequencies with increasing intensity and band with. The stretching frequency of the acceptor group will also be reduced, but often to a smaller degree.
The difference in frequency between ”free” and H-bondet OH- absorption is a measure of the strenght of the H-bondingen.
Advantages with FTIR • Electromagnetic radiation covering the entire frequency area passes through the sample at the same time. Saves tid. 2. Digital spectra are easily manipulated. • Multiple scans give good S/N ratio. • FTIR gives very high resolution. • Substraction of reference spectra or solvents is possible.
Enterpretation of spectra Three impotant areas: 4000 – 1300, 1300 – 900 and 900 – 650 cm-1 4000 – 1300 cm-1: Functional group area. For instance: OH-, NH- og C=O stretch. Overtones from C=O . 1300 – 900 cm-1: ”Fingerprint” area. Often very complex absorption patterns which are unique for every different molecule. 900 – 650 cm-1: Aromatic stuctures absorb strongly in this area. Cross check between the three different areas.
Next class - Functional groups and characteristic features - Tables and charts