Download
1 / 20
240 likes | 511 Vues
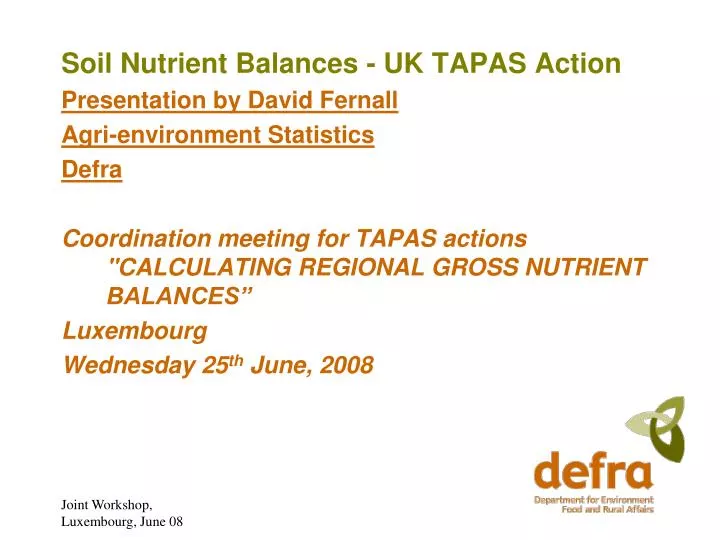
Soil Nutrient Balances - UK TAPAS Action Presentation by David Fernall Agri-environment Statistics Defra Coordination meeting for TAPAS actions "CALCULATING REGIONAL GROSS NUTRIENT BALANCES” Luxembourg Wednesday 25 th June, 2008. Soil Nutrient Balances - UK TAPAS Action Overview

E N D
Soil Nutrient Balances - UK TAPAS Action Presentation by David Fernall Agri-environment Statistics Defra Coordination meeting for TAPAS actions "CALCULATING REGIONAL GROSS NUTRIENT BALANCES” Luxembourg Wednesday 25th June, 2008
Soil Nutrient Balances - UK TAPAS Action Overview • Review of: • policy needs • overall approach • current methodology • data sources • physical data • coefficients • Development of: • system (IT) for calculating balances • outputs and presentation methods • Project approach and summary of findings so far
Soil Nutrient Balances - UK TAPAS Action Review of policy needs • Strong interest from nutrient management, air quality and water quality policy areas in Defra • But may be no “one size fits all” solution for all purposes • Environmentally relevant geographic units • e.g. river catchments, NVZs, Joint Character Areas • Agriculturally relevant units • e.g. by farm sector • Consider hybrid approach using • Full data sets for benchmark years • Approximations for intervening years • Methodology must be “policy sensitive/responsive” • change in livestock breeds, feed regimes, housing regime • GIS (maps) ideal format for presenting results
Soil Nutrient Balances - UK TAPAS Action Review of overall approach • Overall, GNB useful indicator of overall risk of environmental damage • But approach has both strengths & weaknesses • Strengths • Robust generic tool • Relatively simple and transparent • Consistent approach allows benchmarking between MS • Allows analysis of trends over time • Good time series data already available (in UK)
Soil Nutrient Balances - UK TAPAS Action Review of overall approach Weaknesses Large volume of data to collate and calculate Coefficients hard to maintain Complexity & range of components result in scope for wide variation in estimates ADAS study gave estimates 50% higher Needs clear co-ordination and single provider Policy areas have sponsored more elaborate & focussed tools (models, databases) No attempt to estimate loss pathways No interpretation of cumulative effects of balance/surplus Joint Workshop, Luxembourg, June 08
Flowchart of OECD nutrient balance methodology Sheet name Data type Data items Units 1.3 Withdrawals Physical Manure withdrawals Change in manure stocks Tonnes Sheet name Data type Data items Units 1.4 Crops & forage Physical Crop production Pasture production Tonnes Sheet name Data type Data items Units 1.1 Fertilisers Physical Nitrogen fertilisers Sewage sludge Tonnes Sheet name Data type Data items Units 1.2 Livestock Physical Livestock No. head Sheet name Data type Data items Units 1.5 Seeds & planting Physical Seed quantities Tonnes Sheet name Data type Data items Units 1.6 Biological Physical Leguminous crops Organisms in arable/grass Ha Sheet name Data type Data items Units 1.7 Land Use Physical Crops Pasture Ha Physical data Sheet name Data type Data items Units 2.3 Withdrawals Coefficient Manure withdrawals Change in manure stocks kg(N)/Tonne Sheet name Data type Data items Units 2.4 Crops & forage Coefficient Crop production Pasture production kg(N)/Tonne Sheet name Data type Data items Units 2.1 Fertilisers Coefficient Nitrogen fertilisers Sewage sludge kg(N)/Tonne Sheet name Data type Data items Units 2.2 Manure Coefficient Livestock kg/head/year Sheet name Data type Data items Units 2.5 Seeds & planting Coefficient Seed quantities Kg(N)/Tonne Sheet name Data type Data items Units 2.6 Biological Coefficient Leguminous crops Organisms in arable/grass Kg(N)/Ha Sheet name Data type Data items Units 2.7 Deposition Coefficient Crops Pasture Kg(N)/Ha Coefficients Sheet name Data type Data items Units 3.1.2 Manure Volume Livestock Tonnes N/P Sheet name Data type Data items Units 3.1.3 Withdrawals Volume Manure withdrawals Change in manure stocks Tonnes N/P Sheet name Data type Data items Units 3.1.1 Fertilisers Volume Nitrogen fertilisers Sewage sludge Tonnes N/P Sheet name Data type Data items Units 3.1.4 Crops & forage Volume Crop production Pasture production Tonnes N/P + - - Volumes (tonnes/N) Sheet name Data type Data items Units 3.1.5 Seeds & planting Volume Seed quantities Tonnes N/P Sheet name Data type Data items Units 3.1.6 Biological Volume Leguminous crops Organisms in arable/grass Tonnes N/P Sheet name Data type Data items Units 3.1.7 Deposition Volume Crops Pasture Tonnes N/P + + + Sheet name Data type Data items Units 4.1.1 Balance Balance Total inputs Total outputs Tonnes N/P Balance (tonnes/N) =
Soil Nutrient Balances - UK TAPAS Action Review of overall approach • Gross balance or farm balance • Gross or net balance (i.e. net of all air emissions) • OECD Balance not net of gaseous emissions during housing • Need to account for this to get a true “soil” balance • But then include atmospheric deposition from this source • Different results/interpretation when loadings presented as: • per ha of land • per ha agriculturally managed land • per ha fertilised land • IPCC tier 1 & 2 methodologies for nitrous oxide emissions from agricultural soils have some similar elements – we will review and compare in this project
Soil Nutrient Balances - UK TAPAS Action Review of overall approach – estimates of total loading and loss pathways • Balance gives overall measure of environmental pressure but: • No account of farm practices affecting likely impact • No estimate of fate of nutrients/loss pathways • Possible variables/factors to account for: • Manure/slurry storage (e.g. crusting) • Timing & method of manure spreading (e.g. direct injection) • Livestock housing (e.g. concrete floors) • Climatic conditions – rainfall, temperature • Crop sowing time/ground cover • Soil conditions - slope, soil type, organic matter • Identify methods to estimate loss pathways • E.g. NARSES model to estimate ammonia emissions
Soil Nutrient Balances - UK TAPAS Action Review of methodology - Specific issues for small area balances • How much spatial variation is there? • Only calculate balances at spatial scale justified by variation • Need to optimise trade-off between spatial precision and data reliability • Simplification required where data do not support full calculations at fine spatial scale (NUTS3):- • e.g. Calculate at aggregated level (NUTS1) and disaggregate to NUTS3 by manure output & crop uptake data
Soil Nutrient Balances - UK TAPAS Action Review of methodology – a simplified regional approach • ADAS developed simplified approach at NUTS 1 level for UK • Net balance per unit (ha, animal) derived to apply to crop areas and livestock numbers • Useful for quick predictions based on modelled forecasts of changes in farming • Project will assess reliability of this approach, consider other possibilities, and make recommendations
Soil Nutrient Balances - UK TAPAS Action Review of data sources • Sensitivity analysis to determine relative contribution of data components • Inform priority for improving quality of data items • Key issues: • Availability • Spatial scale • Reliability • Timeliness • Future proof
Soil Nutrient Balances - UK TAPAS Action Review of data sources - physical data • Livestock numbers from FSS based on snapshot estimates for June each year • Population profile available for cattle from Cattle Tracing Scheme • Profile data will give slightly improved estimates where cycles are annual and pattern is regular • Becomes more important in event of external shocks (e.g. disease outbreak) • Clear need for improved estimates of fodder production • Fodder requirements – may be scope to estimate based on livestock (meat/milk) production and animal feed volumes • (a) Meat/milk production (b) fodder + (c) feed • Fertiliser use highly correlated with crop type • Reliable estimates at fine spatial scale are possible • Manure use – little movement of manure between farms • Therefore assumptions valid at NUTS3 but not at farm level or 1 km2
Soil Nutrient Balances - UK TAPAS Action Review of data sources - physical data
Soil Nutrient Balances - UK TAPAS Action Review of data sources - coefficients • Difficult to assess quality of coefficients • Need to match to available physical data e.g. livestock categories from FSS • Variation by region and over time – real issue is to ensure coefficients are adjusted to account for all relevant variables • e.g. milk yield, feed regime, pasture quality • Consider scope to scale coefficients by relevant “controlling” factor rather than update regularly • e.g. adjust for milk yield • Need to harmonise/ensure consistency across all countries • and, indeed, within (?case for UK “National Statistic”?) • Strongly support coefficients library with metadata
Soil Nutrient Balances - UK TAPAS Action Development of IT system for calculating balances • OECD spreadsheet system modified to produce NUTS1 level balances • Access-based system being developed to produce NUTS3 level balances • Automatic links to data sources where possible • Aim to develop a simple, transparent, maintainable system • Flexible design to produce balances at different geographic levels • Generic structure to allow use by any country
Soil Nutrient Balances - UK TAPAS Action Development of outputs and presentation methods • Gross balances – but components also very policy relevant • Optional modules for: • gaseous emissions during housing/storage • emissions per ha of land, grazed land or managed land • Maps at NUTS 3 for England • Total loadings per ha • Variation from mean loading or critical loading • Change over time • Simplified method developed to produce early estimates at NUTS1 and 3
Soil Nutrient Balances - UK TAPAS Action Project approach • Use of in-house expertise • Policy (Nutrient management, Air quality, Water Quality, Climate Change) • Science & Applied Statistics (Alistair Murray) • Analysts (Dave Fernall, Matt Elliott, Alison Wray) • External expertise • ADAS (Martyn Silgram, Paul Newell-Price, Ken Smith) • IGER – Institute of Grassland and Environmental Research
Soil Nutrient Balances - UK TAPAS Action Summary Wide range of issues identified on policy needs, methodology, data and presentation • UK figures submitted for OECD balances need reviewing • Gross balance approach generally sound but has scope for adapting to meet specific policy needs • Methodology must be “policy sensitive” and track outcomes • Full system for results at fine spatial resolution for baseline years • Consider developing simplified approach to use in intervening years • Scope to improve data sources for physical data • Scope to use scaling factor to adjust coefficients over time/space • Use geographic units relevant to policy needs • Use of GIS to produce NUTS3 level maps showing state and trend • Building in-house capability and expertise in this area