Download
1 / 25
250 likes | 349 Vues
Dealing with Customer satisfaction within the AMS Austria. Benchmarking Thematic Day Nuremberg, 29 &30 January 2009. Asking customers about their wishes and requirements. Direct involvement of customers

E N D
Dealing withCustomer satisfaction within the AMS Austria Benchmarking Thematic Day Nuremberg, 29 &30 January 2009
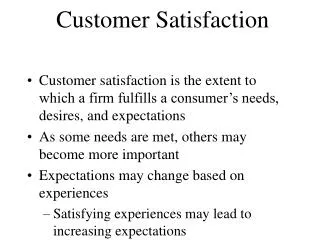
Asking customers about their wishes and requirements • Direct involvement of customers • The AMS has the strategy to involve customers directly into important developments of services (e.g. focus groups). • On federal and local levels there are regular meetings with customers especially with employers, but also meetings with job seekers. • These meetings focus on defined topics, the results influence the internal procedures and services to customers.
Asking customers about their wishes and requirements • Customers feedback system • The feed back of the customers are documented and analysed and influences the processes of customer service. • strategy: Good offices have many documented “complains”!!!! • Involvement of customer representatives (social partners) • Indirect customers are involved by there representatives which take part in all decision taking of the AMS strategy.
Long tradition of customer surveys within AMS • Customer surveys since the early 90th, • Since 1994 standardised central customer surveys • Client Monitoring System (CMS) since 2000, new concept in 2004 • telephone survey of job-seekers and companies by a professional independent research institute, • mixture of questions with marks 1 (very good) to 6 (very bad), multiple choice questions and limited open questions. • splitting the sample into 4 parts - survey at the end of each quarter • Beside CMS there are (many) other surveys on central, regional and local level
Client Monitoring SystemMethods • SAMPLE • Random sample of actual customers • Sample: All registered job-seekers and enterprises with a job vacancy during a specific period of time • Size of sample is representative for each local office • Job-seekers: 120 job-seekers for each local office of which 60 male and 60 female - a total of 11.880 job-seekers • Companies: 80 per local office - a total of 9.900 companies
Client Monitoring SystemPresentation of results • Presentation on local, provinces and at national level, • Many different analysis • women and men, age, education, duration of unemployment, • results for 6 clusters, • Statistical significant differences are shown, • Analysis of causal determinants for each question to identify the main influence on general satisfaction (for each local office),
Main results of Client Monitoring System • Job Seekers • Very satisfied are persons living not in overcrowded areas, who are older than 45, who have lower education and are less than 3 months unemployed. • Women are significantly more critical than man. • Companies • Bigger companies (Key Account Management) and A-Clients are very satisfied (these groups get special service).
Main results of CMS • Best results • Adviser’ soft facts: Friendly and engaged, • Staff takes enough time for counselling, • Assistance concerning matters of unemployment benefit, • Room for improvement • support in solving problems (placement, matching), • Information to companies on financial subsidies
Main results companies Top Box values (1 + 2 out of 6) • Internet Self Service • 2006: 29,5%, • 2007: 30,0%, • 2008: 30,1% • Development • AMS fullfills agreements • 2006: 26,8%, • 2007: 24,4%, • 2008: 26,7% • Development • Information on services and subsidies • 2006: 39,6%, • 2007: 36,5%, • 2008: 37,8% • Development
Main results companies Top Box values (1 + 2 out of 6) • Customer Loyalty • 2006: 74,4%, • 2007: 76,3%, • 2008: 78,5% • Competent Information • 2006: 86,5%, • 2007: 86,2%, • 2008: 88,4% • General satisfaction • 2006: 67,9%, • 2007: 68,1%, • 2008: 71,2% • Speed of placement • 2006: 69,1%, • 2007: 68,3%, • 2008: 70,0%
Main results Job Seekers Top Box values (1 + 2 out of 6) • Usefulness of training measures • 2006: 69,7%, • 2007: 68,4%, • 2008: 69,4% • Development • Satisfied with waiting time • 2006: 66,1%, • 2007: 66,4%, • 2008: 70,2% • Development • AMS fullfills agreements 2006: 37,9%, • 2007: 38,4%, • 2008: 41,3% • Development • Counselling service • 2006: 46,4%, • 2007: 47,2%, • 2008: 53,9% • Development
Main results Job Seekers Top Box values (1 + 2 out of 6) • Assistance unemployment benefits • 2006: 82,4% • 2007: 82,6% • 2008: 83,8% • No pressure by AMS • 2006: 79,4% • 2007: 78,6% • 2008: 79,3% • General satisfaction • 2006: 64,0% • 2007: 64,0% • 2008: 68,4% • Individual action plan • 2006: 73,0% • 2007: 72,1% • 2008: 73,3%
Customer Targets (2004-2007) • Target for each local office according to the position within the cluster • 2 dimensions for job-seekers & companies • Assistance in solving problems • Precisely tailored matching • Targets for the • First quartile: to keep the position • Second quartile: some improvement • Third and fourth quartile: to go above the median
“Customer Satisfaction” within the BSC (since 2007) • job-seekers • overall satisfaction (85 points) • satisfied with service processes (55 points) • companies • overall satisfaction (85 points) • satisfied with service processes (55 points) • Points for customer satisfaction and Targets in the BSC • all points in the BSC: 1.000 • points for customer satisfaction: 280 • points for reaching all business targets: 220
Management Assessment(Every three years each of the regions) • According to the decentralization of AMS Austria the main actors are the regional managements and performance is up to their responsibility. The responsibility of the central head office is to monitor the activities and to set goals by the steering system. • Regions with room for improvement are asked for special programs to improve their results. Also all regions report regularly on their activities to improve. There are also management-assessments in the regional and local offices on activities to improve customers satisfaction on basis of contracts between the central head and the regional managements
“Best of AMS Award” since 2004 • Nominated are the customer friendliest local offices (each cluster) • In each cluster (ratings of job-seekers & companies) • Dimensions: matching (25%), assistance in solving problems (25%) and advisers soft facts (50%) • Nominated are the women friendliest local offices (each cluster) • Only ratings by female job-seekers • Dimensions: Over-all satisfaction (70 %), item „equal opportunities“ (15%) and item „sexual discrimination“ (15%)
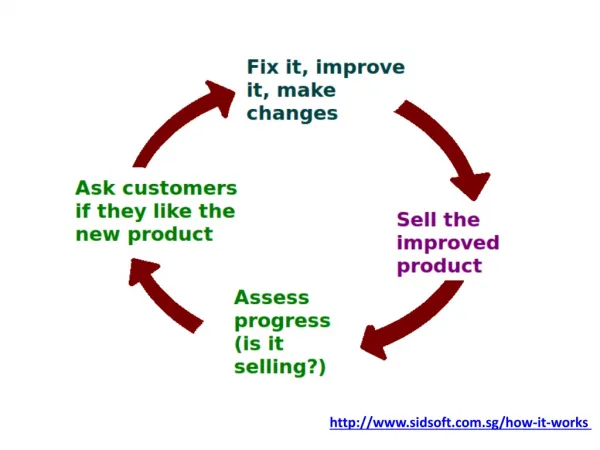
PROJECT: „Precisely Tailored Matching“ as model for mutual learning (2004) • Assessments of local offices with excellent results in customer satisfaction to identify good practices • Documentation of the good practice (behaviour and activities of the best staff members in this offices) • Definition of standards how to behave with customers • Communication of the good practice examples within the organisation • Reporting system of the activities in regional and local offices
PROJECT: „Precisely Tailored Matching“ as model for mutual learning (2004) • Some examples of the regions • Internal or external job coaching of the local staff • Good practice transfer on local level • Agreements on cooperation between “Service for Job Seekers” and “Service for Employers” • Specific additional surveys • Identification of employees about whom customers complain often • Special training measures for offices with bad results • Better information of customers to avoid misunderstandings about the agreements between customers and AMS
Project pi Project of an regional office 2007 • Starting point
Project pi Project of an regional office 2007
First standards developed by the staff Knowledge about the situation of the customer Welcome of costumers Finalisation and summarisation of the meeting Agreement of the next steps Working with IT or with the customer? (Information to customer what the staff is putting into the IT system and why) Standards still to be developed Time, patience and speed of speaking courtesy and appraisal Giving customer information Level of service (number and quality of the job offers) Problem solving from the view of the customer Leading the conversation by staff Structure of the approach in guidance Standards for the accommodation of the office (living room for staff or working room for the customer?) „Wording“ Project pi Project of a local office 2007
Project pi - Results Project of a local office 2007 • 04/07-03/08:62,9
Other surveys on customer satisfaction • Additional to the CMS there are some other surveys • On the use of the internet tools, e-services, vocational guidance, information centres, different customer groups • In some of the regions customer satisfaction is measured in customer surveys on individual staff.
Connection between Customer Satisfaction and Business Results • There is no clear connection (Example Service for Job Seeker) • Correlation “Customer Satisfaction” – “Business Targets”: 0,15 This means also there is no contradiction between business results and achievement of high customer satisfaction. From the 10 best offices in customer satisfaction 4 offices achieve all business targets. From the 10 worst offices in customer satisfaction 2 offices achieve all business targets. • The “highest” correlation is between • Correlation “Customer Satisfaction” – “Appraisal of management by staff”: 0,31 • Correlation “Customer Satisfaction” – “Internal cooperation”: 0,38