Download
1 / 14
140 likes | 221 Vues
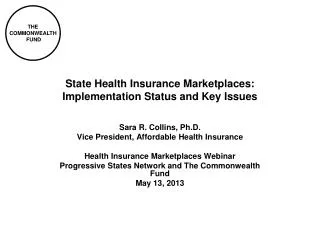
Sara R. Collins, Ph.D. Vice President, Health Care Coverage and Access The Commonwealth Fund SABEW: The Business of Health Care New York, NY January 22, 2014. THE AFFORDABLE CARE ACT’S MARKETPLACES Results From The First Three Months.

E N D
Sara R. Collins, Ph.D. Vice President, Health Care Coverage and Access The Commonwealth Fund SABEW: The Business of Health Care New York, NY January 22, 2014 THE AFFORDABLE CARE ACT’S MARKETPLACES Results From The First Three Months
Exhibit 1. Trends in Cumulative Number of Individuals Who Have Selected a Marketplace Plan Through the Federally-facilitated Marketplace (FFM), October 1 to December 28, 2013 Source: Health Insurance Marketplace: January Enrollment Report, For the Period: October 1, 2013 – December 28, 2013, ASPE Issue Brief, U.S. Department of Health and Human Services, January 13, 2014, http://aspe.hhs.gov/health/reports/2014/MarketPlaceEnrollment/Jan2014/ib_2014jan_enrollment.pdf.
Exhibit 2. More than 2 Million People Have Selected or Enrolled in Marketplace Plans, as of Dec. 28, 2013 *People who have selected a marketplace plan may or may not have paid their premiums, and thus finalized their enrollment. Source: Health Insurance Marketplace: January Enrollment Report, For the Period: October 1, 2013 – December 28, 2013, ASPE Issue Brief, U.S. Department of Health and Human Services, January 13, 2014,http://aspe.hhs.gov/health/reports/2014/MarketPlaceEnrollment/Jan2014/ib_2014jan_enrollment.pdf; and state websites.
Exhibit 3. Ten States Have Reached or Exceeded Their Three Month Marketplace Enrollment Target as of Dec. 28, 2013 Percent of three month enrollment target reached by 12/28/2013 NH WA VT ME MT ND AK MN OR NY WI ID MA SD RI WY MI CT PA IA NJ OH NE NV DE IN IL MD UT WV VA CO DC CA KS MO KY NC TN OK SC AZ AR NM GA AL MS HI LA TX FL <50% 75%-<100% 100%+ 50%-<75% Source: Memo from Marilyn Tavenner, CMS Administrator, Projected Monthly Enrollment Targets for Health Insurance Marketplaces in 2014, September 5, 2013, http://waysandmeans.house.gov/uploadedfiles/enrolltargets_09052013_.pdf; Health Insurance Marketplace: January Enrollment Report, For the Period: October 1, 2013 – December 28, 2013, ASPE Issue Brief, U.S. Department of Health and Human Services, January 13, 2014, http://aspe.hhs.gov/health/reports/2014/MarketPlaceEnrollment/Jan2014/ib_2014jan_enrollment.pdf
Exhibit 4. Trends in Cumulative Number of Young Adults Who Have Selected a Marketplace Plan Through the Federally-facilitated Marketplace (FFM), October 1 to December 28, 2013 Source: Health Insurance Marketplace: January Enrollment Report, For the Period: October 1, 2013 – December 28, 2013, ASPE Issue Brief, U.S. Department of Health and Human Services, January 13, 2014, http://aspe.hhs.gov/health/reports/2014/MarketPlaceEnrollment/Jan2014/ib_2014jan_enrollment.pdf.
Exhibit 5. Distribution of Marketplace Visitors and Marketplace Enrollees by Age Adults who selected a marketplace plan Adults ages 19–64 who are uninsured or have individual coverage and went to marketplace 45-54 22% 35-44 15% 35–49 31% 19–34 41% 18-34 24% 55-64 33% 50–64 28% <18 6% Note: Segments may not sum to 100 percent because of rounding. Source: The Commonwealth Fund Affordable Care Act Tracking Survey, Dec. 2013 and Health Insurance Marketplace: January Enrollment Report, For the Period: October 1, 2013 – December 28, 2013, ASPE Issue Brief, U.S. Department of Health and Human Services, January 13, 2014, http://aspe.hhs.gov/health/reports/2014/MarketPlaceEnrollment/Jan2014/ib_2014jan_enrollment.pdf.
Exhibit 6. More than Three-Fourths of Visitors Report Being in Excellent, Very Good, or Good Health Health status 35–49 31% Very good 37% Good 23% 19–34 41% Fair 17% Excellent 17% Poor 6% 50–64 28% Don’t know or refused 1% Adults ages 19–64 who are uninsured or have individual coverage and went to marketplace Note: Segments may not sum to 100 percent because of rounding. Source: The Commonwealth Fund Affordable Care Act Tracking Survey, Dec. 2013.
Exhibit 7. By Dec. 2013, More Adults Who Visited the Marketplaces Found It Easy to Compare Plan Benefits and Premiums How easy or difficult was it to compare the … of different insurance plans? Very difficult or impossible Somewhat easy Very easy Somewhat difficult 58 30 Benefits covered 51 43 37 52 Premium costs 42 51 51 34 Potential out-of-pocket costs* 54 38 Percent Adults ages 19–64 who are uninsured or have individual coverage and went to marketplace Note: Bars may not sum to 100 percent because of “don’t know” responses or refusal to respond; segments may not sum to subtotals because of rounding. * Potential out-of-pocket costs from deductibles and copayments. Source: The Commonwealth Fund Affordable Care Act Tracking Surveys, Oct. 2013 and Dec. 2013.
Exhibit 8. Adults Who Visited the Marketplaces Continued to Report Difficulties Finding a Plan with the Type of Coverage They Needed How easy or difficult was it to find…? Very difficult or impossible Somewhat easy Very easy Somewhat difficult A plan with the type of coverage you need 56 38 60 36 61 30 A plan you could afford 58 37 Percent Adults ages 19–64 who are uninsured or have individual coverage and went to marketplace Note: Bars may not sum to 100 percent because of “don’t know” responses or refusal to respond; segments may not sum to subtotals because of rounding. * Potential out-of-pocket costs from deductibles and copayments. Source: The Commonwealth Fund Affordable Care Act Tracking Surveys, Oct. 2013 and Dec. 2013.
Exhibit 9. Marketplace Plan Selection by Metal Level and Financial Assistance Status, October 1 to December 28, 2013 Percent of individuals who selected a plan Yes No Platinum Bronze Silver Gold Catastrophic Source: Health Insurance Marketplace: January Enrollment Report, For the Period: October 1, 2013 – December 28, 2013, ASPE Issue Brief, U.S. Department of Health and Human Services, January 13, 2014, http://aspe.hhs.gov/health/reports/2014/MarketPlaceEnrollment/Jan2014/ib_2014jan_enrollment.pdf.
Exhibit 10. A Majority of Adults Who Have Visited the Marketplaces Rate Their Experience as Fair or Poor Overall, how would you describe your experience in trying to get health insurance through the marketplace in your state? Percent Adults ages 19–64 who are uninsured or have individual coverage and went to marketplace Source: The Commonwealth Fund Affordable Care Act Tracking Surveys, Oct. 2013 and Dec. 2013.
Exhibit 11. A Majority of Adults Who Visited the Marketplaces Went More Than Once; Three of 10 Said Their Experience Improved Over the Course of Their Visits How many times did you visit the marketplace—did you visit once, or more than once? From your first visit to your last visit, did your experience in trying to get health insurance through the marketplace in your state…? Improved 29% Stayed about the same 52% Once 39% More than once 59% Got worse 18% Don’t know or refused 2% Adults ages 19–64 who are uninsured or have individual coverage and went to marketplace more than once Adults ages 19–64 who are uninsured or have individual coverage and went to marketplace Source: The Commonwealth Fund Affordable Care Act Tracking Survey, Dec. 2013.
Exhibit 12. A Majority of Adults Potentially Eligible for Coverage Who Have Not Yet Enrolled Say They Are Likely to Shop for Coverage by March 31, 2014 The enrollment period for health insurance in the marketplaces ends on March 31, 2014. How likely are you to go to/go back to the marketplace by March 31, 2014, to enroll in a health plan or find out if you are eligible for financial help to pay for your plan or for Medicaid? Very unlikely Somewhat likely Somewhat unlikely Very likely 37 59 Age 39 58 32 61 40 55 Health Status 55 41 28 67 Percent Adults ages 19–64 who are uninsured or have individual coverage* and who have not gone to marketplace, or went to marketplace but did not apply or did not enroll Notes: Bars may not sum to 100 percent because of “don’t know” responses or refusal to respond; segments may not sum to subtotals because of rounding. * Respondents with individual market coverage who said they had received an offer from their insurance carrier to renew their plan for 2014 and said they planned to keep their policies were excluded from this analysis. Source: The Commonwealth Fund Affordable Care Act Tracking Survey, Dec. 2013.
Acknowledgements Tracy Garber Senior Policy Associate Health Care Coverage and Access David Blumenthal President Michelle Doty Vice President Survey Research and Evaluation Petra Rasmussen Senior Research Associate Health Care Coverage and Access