Download
1 / 5

E N D
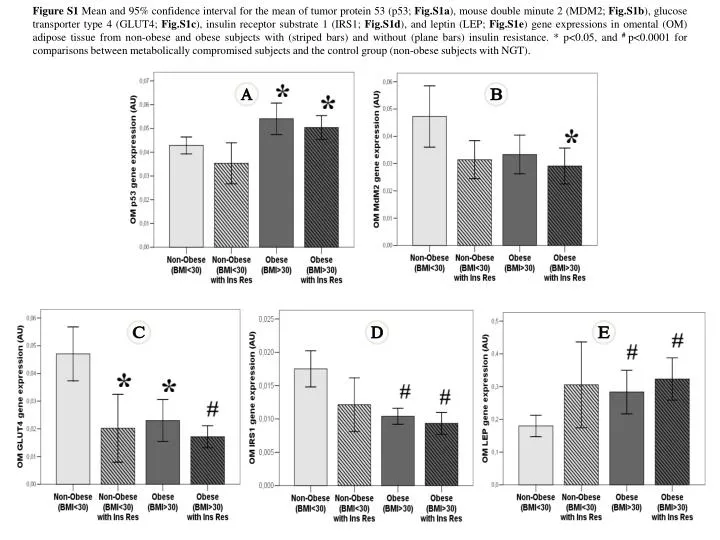
Figure S1Mean and 95% confidence interval for the mean of tumor protein 53 (p53; Fig.S1a), mouse double minute 2 (MDM2; Fig.S1b), glucose transporter type 4 (GLUT4; Fig.S1c), insulin receptor substrate 1 (IRS1; Fig.S1d), and leptin (LEP; Fig.S1e) gene expressions in omental (OM) adipose tissue from non-obese and obese subjects with (striped bars) and without (plane bars) insulin resistance. * p<0.05, and # p<0.0001 for comparisons between metabolically compromised subjects and the control group (non-obese subjects with NGT). A B C D E
Figure S2 Upper panels:mean and 95% confidence interval for the mean of total p53 (Fig.S2a), phosphorylated p53 (P-p53; Fig.S2b, and acetylated p53 (A-p53; Fig.S2c) in omental (OM) adipose tissue from non-obese, obese, and obese subjects with T2D. Lower panels: linear relationships between body mass index (kg/m2) and total p53 (Fig.S2d), phosphorylated p53 (P-p53; Fig.S2e), and acetylated p53 (A-p53; Fig.S2f) in omental fat from volunteers with NGT (blue circles). Red diamonds represent data from omental fat from obese patients with T2D. A B C p=0.009 p=0.08 p=0.04 D E F p=0.04 p=0.05 p<0.01
Figure S3 Mean ± 2.0 SE for the mean of total p53 protein levels (Fig.S4a) in 3T3-L1 adipocytes during in vitro differentiation, and gene expression (Fig.S4b) in mature adipocytes treated with LPS. * p<0.05 for comparisons with pre-adipocytes/non-treated cells. A B
Figure S4 Surgery-induced weight loss modifications of p53 (Fig.S3a), MDM2 (Fig.S3b), GLUT4 (Fig.S3c), IRS1 (Fig.S3d), and LEP (Fig.S3e) gene expression. Further anthropometric and clinical modifications are shown in Supplementary Table S1. A B C D E
Figure S5 Effects of metformin (Metf) in ex vivo treated explants of subcutaneous adipose tissue.