Download
1 / 28
280 likes | 377 Vues
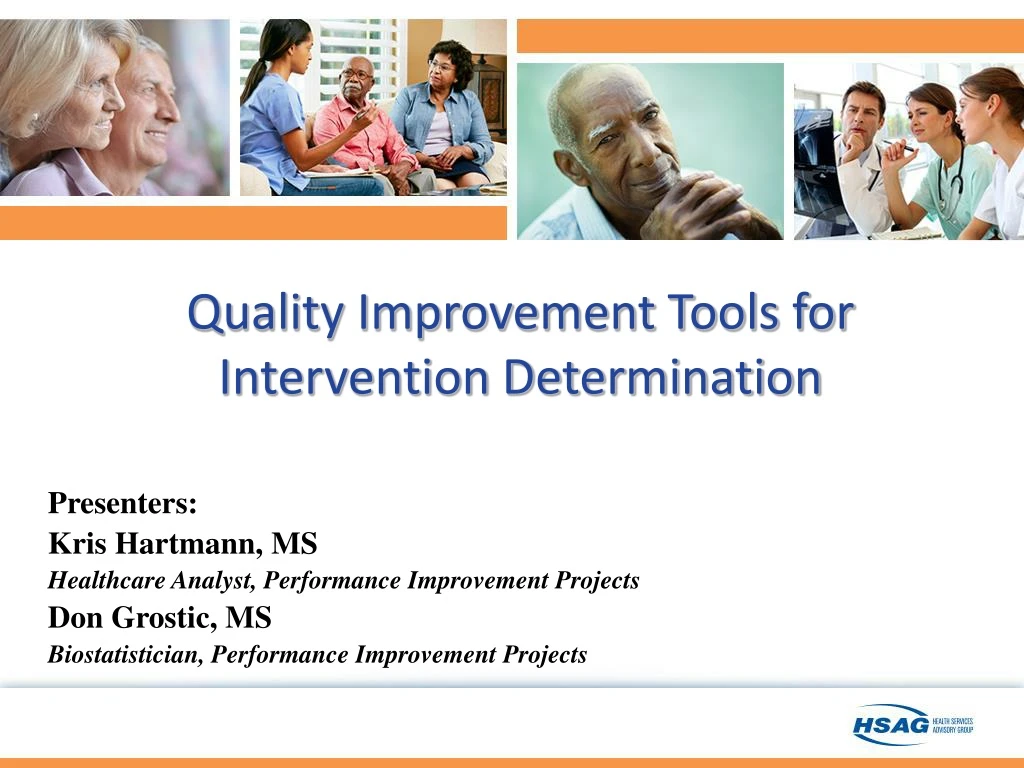
Quality Improvement Tools for Intervention Determination. Presenters: Kris Hartmann, MS Healthcare Analyst, Performance Improvement Projects Don Grostic, MS Biostatistician, Performance Improvement Projects. Objectives of the Workshop.

E N D
Quality Improvement Tools for Intervention Determination Presenters: Kris Hartmann, MS Healthcare Analyst, Performance Improvement Projects Don Grostic, MS Biostatistician, Performance Improvement Projects
Objectives of the Workshop • To share the latest knowledge on quality improvement tools. • To address identified opportunities for improvement from prior Florida PIP validations. • To support current efforts in determining interventions for ongoing PIPs. • To provide a systematic, step-by-step approach that can be used to select impactful interventions.
Summary of Objectives • To empower you, your team, and your organization to answer the question: “What changes can we make that will result in improvement?”
Quality Improvement Tools • Team Building • Process Mapping • Failure Modes and Effects Analysis (FMEA) • Pareto Diagram • Failure Mode Priority Ranking
Building a PIP Team • Including the right people on the PIP team is critical to a successful improvement effort. • Teams may vary in size and composition. • Team composition should be driven by the PIP topic.
Building a PIP Team: Senior Management A Sponsor from Senior Management: • Is critical to support the PIP team efforts. • Serves to link the PIP team with senior management and assure alignment with the organizational strategy. • Provides resources and assists with overcoming organizational barriers on behalf of the team. • Enables the PIP Team to make the changes necessary to improve the process.
Building a PIP Team: Clinical Support A clinical leader: • Is critical to the PIP team efforts. • Provides insight into the clinical implications of potential interventions and can anticipate the impact of system changes. • Should come from the areas of the organization that are relevant to the PIP topic.
Building a PIP Team: Analytical Support Analytical Support: • Should be included from the beginning of the project. • Provides sound methodology upon which the project is based. • Ensures that outcomes are accurately measured.
Building a PIP Team: Step-by-Step Approach Steps to develop an effective team: • Review the PIP topic. • Consider the process being targeted for improvement. • Include team members who are knowledgeable about the different levels and steps of the process. • Include analytical support from the beginning of the project.
Building a PIP Team: Step by Step Approach • Identify an executive sponsor who takes responsibility for the success of the project. • Consider including partners from external organizations that are part of the process.
Process Mapping A process map is: • A quality improvement tool that illustrates how a current process is being administered. • A global view of all the steps in the current process to determine where improvement efforts are most needed. • Most effective if it is documented from the perspective of the person most affected by the overall process, typically the enrollee.
Building A Process Map: Step-by-Step Approach • Determine the beginning and ending points. • Involve the individuals responsible for the different steps of the process. • Determine 3–5 prominent phases that occur for the process to work. • List the activities for each phase of the process. • Obtain feedback from all team members before finalizing the process map.
Questions and Answers Questions on Team Building and Process Mapping
Quality Improvement Tools • Team Building • Process Mapping • Failure Modes and Effects Analysis (FMEA) • Pareto Diagram • Failure Mode Priority Ranking Presenter: Don Grostic, MS Biostatistician, Performance Improvement Projects
Failure Modes and Effects Analysis A Failure Modes and Effects Analysis (FMEA) is: • A systematic, proactive method for evaluating a process. • A quality improvement tool that helps identify where and how a process is failing or might fail in the future. • Useful to pinpoint specific steps most likely to affect the overall process so interventions can have the desired impact on PIP outcomes.
Failure Modes and Effects Analysis Failure Modes: What could go wrong? Any scenario that could go wrong (failing now or can go wrong in the future). Failure Causes: Why would the failure happen?Explanation of why the failure mode would occur; what is the root cause of the failure? Failure Effects: What is the consequence of the failure? What is the aftermath of the failure?
Steps for Conducting FMEA • Determine up to three sub-processes from the process map that will have the most impact on improving the PIP outcomes. • Include all individuals responsible for the chosen sub-processes. • Brainstorm all failure modes that can occur for each sub-process.
Steps for Conducting FMEA • Brainstorm failure causes and effects for each failure mode. • Evaluate the results and determine the priority ranking for each failure mode. • Obtain feedback from all individuals before finalizing the FMEA.
Failure Modes and Effects Analysis Priority Ranking • Priority ranking allows for the highest ranked failure modes to take precedence when determining the interventions to be tested. • The highest priority failure modes are those that have the most leverage on affecting the PIP Outcomes. • The priority ranking should be based on MCO data and experience.
Pareto Diagram A Pareto diagram is another method to identify specific areas in the overall process that warrant interventions. When to use a Pareto chart: • Analyzing data about the frequency of problems or causes in a process. • There are many problems or causes and you must focus on the most significant. • Analyzing broad causes by looking at their specific components. • Communicating to others about your data.
Pareto Diagram Example: Preventive Dental Visits 100% 90% 80% 70% 60% 50% 40% 30% 20% 10% 0% Cumulative Percentage
Priority Ranking: Risk Priority Number (RPN) The RPN is a numeric assessment of risk or impact of each sub-process. The RPN has three basic components: • Likelihood that the failure would occur. • Likelihood that the failure would not be detected. • The amount of harm or damage the failure mode may cause. Each Component is ranked on a scale of 1 to 5: (Low Risk) 1--------------------------------------5 (High Risk)
Intervention Determination • The ranked failure modes should be used as a guide to determine the interventions to be tested. • The failure modes with the higher ranking need more attention.
Intervention Determination Example: Preventive Dental Visits
Questions and Answers Discussion and Breakout Sessions