Download

1 / 24
460 likes | 2.46k Vues
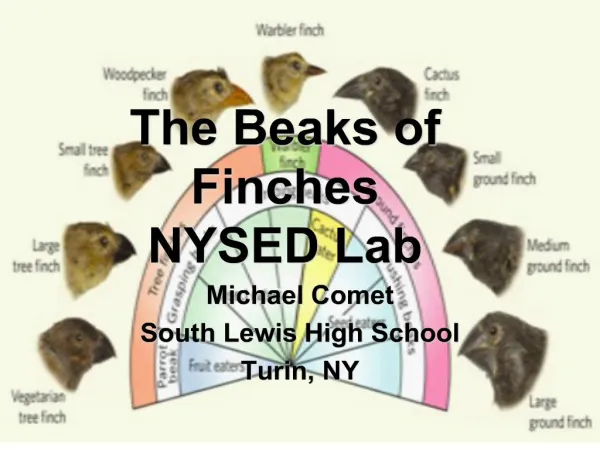
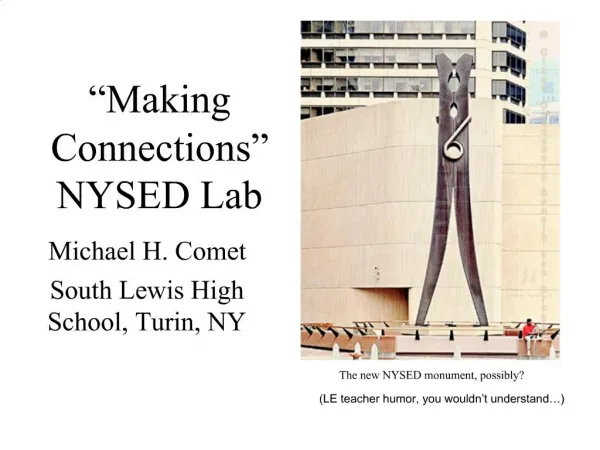
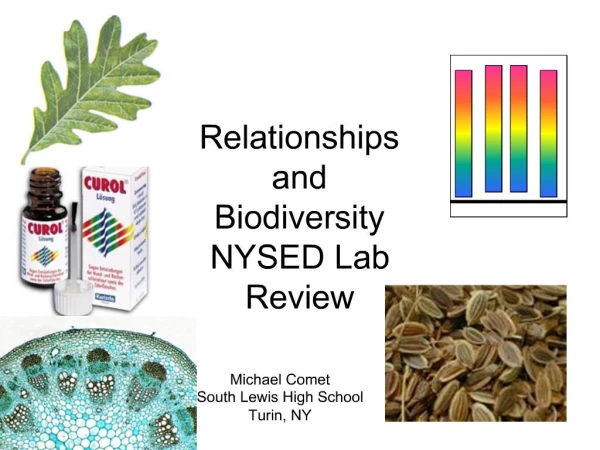
Relationships and Biodiversity NYSED Lab Review. Please note:.

E N D
Please note: • “Curol” is a fictitious plant extract mentioned in the NYSED lab that has the ability to effectively treat cancer. IT DOES NOT EXIST. Likewise, any “Curol” images included in this presentation are simply images taken from an internet search and are not a cancer cure. It is simply a product found with a similar name. I do not know what it is used for as the website was not translated into the English language.
What does this lab entail? • Seven tests that look at the physical, chemical, and microscopic characteristics of three plants that may be able to create Curol, even though they are not Botana curus (the plants that does produce it). • Comparison of data to determine relationships. • Define the crucial need for biodiversity.
Test 1 - Structural Characteristics of Plants QUESTION: Which leaves most closely resemble the leaves produced by Botana curus? Record your observations in the data table. Species Z Botana curus Species Y Species X
Test 2 – Structural Characteristics of Seeds QUESTION: Which seeds most closely resemble the seeds produced by Botana curus? Record your observations in the data table. Botana curus seeds Species X seeds Species Y seeds Species Z seeds
Test 3 – Microscopic Internal Structures of Stems QUESTION: Which stem structures most closely resemble the stem structures of Botana curus? Record your observations in the data table. Species X Botana curus Species Y Species Z
Test 4 – Paper Chromatography to Separate Plant Pigments Water migrates up paper via capillary action and carries plant pigments with it. B.curus X Y Z B.curus X Y Z “Spot” your chromatography paper and label it with a pencil.
Test 5 – Indicator Tests for Enzyme M Botana curus Botana curus (“fizzed” a little) Species X Species X (no “fizz”) Indicator Enzyme M Species Y Species Y (“fizzed” a little) Species Z Species Z (“fizzed” a little) Add a small sprinkle of “Indicator Enzyme M” Put two drops of each plant Extract in separate wells of the well tray. Record your results.
Test 6 – Using Simulated Gel Electrophoresis to Compare DNA The strips below represent the DNA strands extracted from each plant (B. curus, X, Y, and Z). Each strand will be “cut” between a double C/double G. Therefore, lines are drawn below where each strip should be cut. Then, count up the number of bases and paste appropriately in the simulated Gel Electrophoresis table on the next slide. Botana curus A T T C C G G A T C G A T C G C C G G A T A T A C T C C G G T A A T A T C Species X A T T G T A C C G G G A T C C G G A C G T C G C G A C T A A T A T A G C A Species Y A C C G G T C C G G G A T C G C A C C C G G T A C T C C T G T A A T A T C Species Z A T T C C G G A T C G A T C G C C G G A T A T T C T C C G G T A A T A T
And where did you get those Amino Acids from??? Your friend and mine… The Universal Genetic Code Chart
So, what is the closest and most probable alternative source for Curol???
Questions: • Paper chromatography can be used to investigate evolutionary relationships. Leaves from a plant were ground and mixed with a solvent. The mixture of ground leaves and solvent was then filtered. Using a toothpick, twenty drops of the filtrate (material that passed through the filter) were placed at one spot on a strip of chromatography paper. This procedure was repeated using leaves from three other species of plants. A separate strip of chromatography paper was prepared for each plant species. Each of the four strips of chromatography paper was placed in a different beaker containing the same solvent for the same amount of time. One of the laboratory setups is shown below.
State one reason for using a new toothpick for the filtrate from each plant. [1] • 2. State one way the four strips would most likely be different from each other after being removed from the beakers. [1] • 3. State how a comparison of these resulting strips could indicate evolutionary relationships. [1]
Base your answer to question 4 on the portion of the mRNA codon chart and information below. • How would the amino acid sequence produced by the mutant strand (series II) compare to the amino acid sequence produced by series I? (1) The amino acid sequence would be shorter. (2) One amino acid in the sequence would change. (3) The amino acid sequence would remain unchanged. (4) More than one amino acid in the sequence would change.
Base your answers to questions 5 through 7 on the diagram below and on your knowledge of biology. Letters A through L represent different species of organisms. The arrows represent long periods of geologic time. • 5) Which two species are the most closely related? (1) J and L (2) G and L (3) F and H (4) F and G
Which species was best adapted to changes that occurred in its environment over the longest period of time? (1) A (2) B (3) C (4) J
Which two species would most likely show the greatest similarity of DNA and proteins? (1) B and J (2) G and I (3) J and K (4) F and L
Base your answers to questions 8 through 11 on the information and diagram below and on your knowledge of biology. The four wells represented in the diagram were each injected with fragments that were prepared from DNA samples using identical techniques. This laboratory procedure is known as (1) cloning (2) gel electrophoresis (3) chromatography (4) use of a dichotomous key
The arrow represents the direction of the movement of the DNA fragments. What is responsible for the movement of the DNA in this process? [1] • 10) The four samples of DNA were taken from four different individuals. Explain how this is evident from the results shown in the diagram. [1] • 11) Identify the substance that was used to treat the DNA to produce the fragments that were put into the wells. [1]
Base your answers to questions 12 through 13 on the information provided and on your knowledge of biology. • A student observed the physical characteristics of seven organisms and prepared the data table below. • Which characteristic from the data table did the student use to group the organisms? [1]
Another classmate suggested that the earthworm is more closely related to the jellyfish than to any other organism observed. State the evidence from the data table that the student most likely used for this suggested relationship. [1] • Fish and snakes are very different organisms, yet they have many similarities. Provide a biological explanation for the fact that fish and snakes have so many characteristics in common. [1]