Download
1 / 14
150 likes | 330 Vues
Economics 310 Price Theory. Second Exam-Spring 2001 Department of Economics College of Business and Economics California State University-Northridge Professor Kenneth Ng. Monday, October 13, 2014. Question 1: Version A.

E N D
Economics 310Price Theory Second Exam-Spring 2001 Department of Economics College of Business and Economics California State University-Northridge Professor Kenneth Ng Monday, October 13, 2014
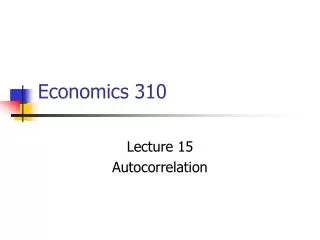
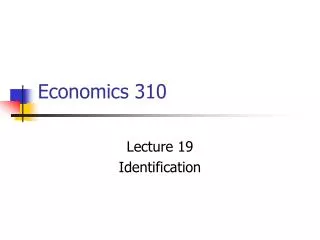
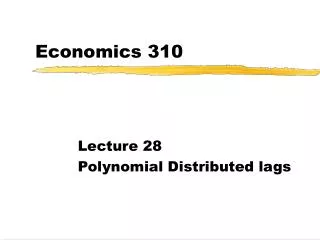
Question 1: Version A • (30 points). Suppose a firm is efficiently producing 100,000 units of a good using two inputs, capital and labor and a total cost of $750,000 • Depict the situation on the graph below if the firm is using 500 units of capital. • Suppose the firm could increase output in the short run to 150,000 units. If it did so it would produce at an average variable cost of $8 and an average total cost of $10. Depict the situation on the graph. • What is the price of capital? Compute and explain. • If labor costs $2 per unit how many units of labor would the firm use to produce 100,000 and 150,000 units of the good? Compute and show these quantities on your graph. • Suppose new technology was introduced that allowed the firm to produce 50% more output with the same capital. Show what this will do the iso-output curve for 100,000 units. • What effect will this have on the MRS between capital and labor? Explain and show on your graph.
Capital Labor 225,000 500 1000 $750K 100,000 Units A B 150,000 Units $1,500,000 600,000 With an ATC of $10, the firms TC at point B is 1.5 million. With an AVC of $8, the firm is spending 1.2 million on labor at point B. This leaves $300,000 to spend on capital. Capital costs $600 per unit. If labor costs $2 per unit, the firm is spending $450,000 on labor at point A. The firm is using 225,000 units of labor. At B the firm is spending 1.2 million on labor or 600,000 units of labor. 0
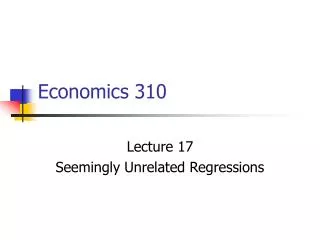
Capital Labor 225,000 500 100,000 Units A 600,000 150,000 Units The iso-output curve for 100,000 units will shift in. The iso-output curve will become flatter (MRS falling). The loss of one unit of labor will require less additional capital to keep output constant because capital has is now more productive. 0
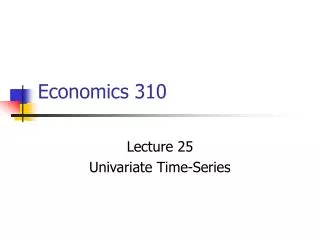
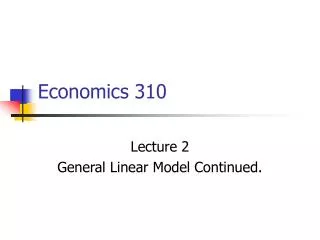
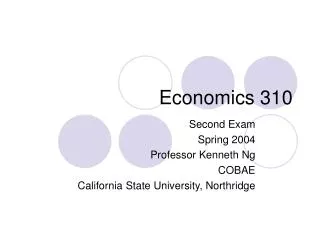
Question 1: Version B • (30 points). Suppose a firm is producing 100 units of a good efficiently with 250 units of capital. • A.Depict the situation on the graph below. • B.Suppose capital costs $20 per unit and the ATC of producing 100 units is $75. Label the iso-cost curve on your graph. • C.If the firm uses 50 units of labor, what is the price of labor? • D.In the short run, the firm increases output from 100 to 500 units. After increasing output to 500 units in the short run, the ATC of production increases by 200%. Depict the situation on your graph. • E.How many units of labor is the firm using? Show your calculations. • F.Label output levels of 100 and 500 units on a unit cost diagram. • G.In the long run, the firm continues to produce 500 units, but does so with no change in the ATC of production compared to producing 100 units. Depict the change on your graph. • H.How many units of labor is the firm using to produce 500 units in the long run? Show your calculations and Explain.
Capital Labor 50 250 $7,500 100 units A B 500 Units $112,500 5375 The total cost of producing 100 units of $7,500 (100*75). At point A, the firm is spending $5000 on capital and $2,500 on labor. This means that labor costs $50 per unit ($2,500/50). At point B, the ATC is $225 (3*75). So the total cost at B is $112,500. If labor costs $50 per unit and the firm is spending $107,500 on capital. If capital costs $20 per unit, the firm is using 5375 units of capital. 0
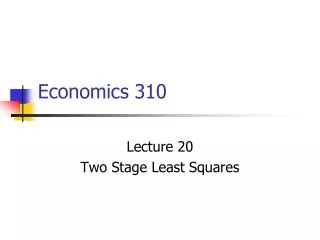
Capital Labor 50 250 $7,500 100 units A B 500 Units $112,500 5375 C In the long run the firm will move to point C. If ATC at C is $75, the green iso-cost line must be for $37,500. 0
Question 2 Question 2 (70 points). Read the article on page 4. Consider three auto makers, Ford, Toyota, and Chrysler. • Draw iso-output curves for a given level of output assuming that when the 3 companies are ranked by productivity, Ford is first, Toyota is second, and Chrysler is third. Explain the logic behind your drawing. • Draw unit cost curves and the short run industry supply curve assuming Ford, Toyota and Chrysler are the only three firms producing autos. Explain the shape of your short run supply curve and label all relevant points. • Use your graphs to analyze what would happen if there was a large drop in demand for autos. Explain your graphical analysis. Read the article on page 7. • Use the graph below to show what will happen to the price of automobiles and the output of the auto industry as a result of the events described in the article. Label and provide a description of each significant event. • Use the graphs on the next page to show and explain the effect of the events described on page 7 in the auto industry.
Capital Labor Ford-100,000 Units Toyota-100,000 Units Chrysler-100,000 Units • Draw iso-output curves for a given level of output assuming that when the 3 companies are ranked by productivity, Ford is first, Toyota is second, and Chrysler is third. Explain the logic behind your drawing. 0
Ford Toyota Chrysler P4 P3 P2 P1 qf qt qc Short Run Market Supply Ford begins producing in short run P4 P3 Chrysler begins producing in short run P2 Toyota begins producing in short run P1 Market Demand qf
Ford Toyota Chrysler P4 loss P3 profit P2 P1 SRS after exit of Chrysler Short Run Market Supply P3 P2 P1 Market Demand
Ford Toyota Chrysler profit P4 profit P3 P2 P1 SRS after exit of Chrysler Short Run Market Supply P3 P2 P1 Market Demand
Policies • One week mandatory cooling off period.