Download
1 / 28
280 likes | 427 Vues
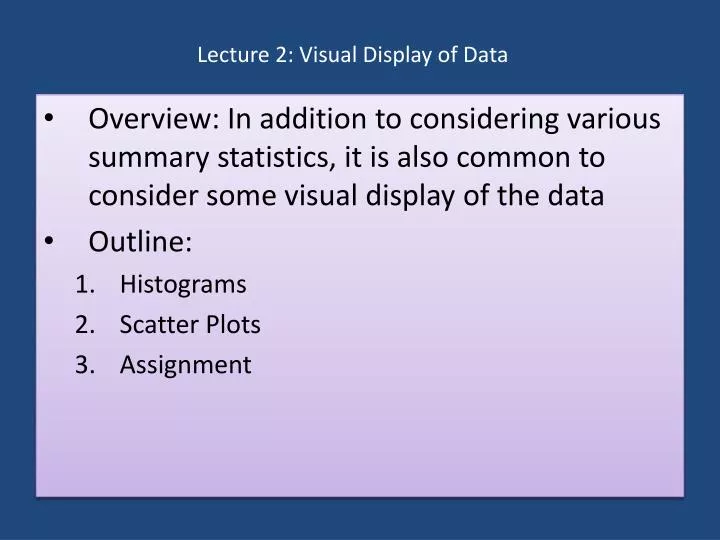
Lecture 2: Visual Display of Data. Overview: In addition to considering various summary statistics, it is also common to consider some visual display of the data Outline: Histograms Scatter Plots Assignment. 1. Histograms. Frequency Distributions.

E N D
Lecture 2: Visual Display of Data • Overview: In addition to considering various summary statistics, it is also common to consider some visual display of the data • Outline: • Histograms • Scatter Plots • Assignment
1. Histograms Frequency Distributions • Consider the experiment of measuring the leaf surface area (LSA) of a certain type of plant in a certain location • It’s possible that we could make tens of thousands of measurements and it’s possible that we obtain several “repeat” measurements for various values • For example, we may find that 1057 of the plants we observed had LSA 35 in2 and 239 of the plants we observed had LSA 13 in2; and so on • If we were to plot the LSA vs. the frequency that number was observed, we would obtain a frequency distribution
1. Histograms Normal Distribution • There’s a good chance our plot may look like this: • This is the familiar “bell-curve” – a normal distribution 1057 frequency LSA (in2) 35
1. Histograms Normal Distribution • If the data are normally distributed then, ≈68.3% of the values are within 1 standard deviation of the mean; ≈95.4% within 2 SDs; ≈99.7% within 3 SDs • In any distribution, smaller σ implies data are closer together and larger σ implies data are spread further apart
1. Histograms Probability Distributions • There are many different probability distributions: • As can be seen here, the type of underlying variable- discrete or continuous- determines the type of distribution function- probability mass function or probability distribution function
1. Histograms Probability Distributions & Histograms • (Back to our experiment) Realistically, we won’t obtain enough measurements for our distribution to be a nice, smooth curve. A histogram is an estimate of the probability distribution of a continuous variable:
1. Histograms Constructing a Histogram • Decide on the number of classes (bars) for the histogram • Typically 10-20, but for a small dataset, 4-6 • Determine the width of the classes (CW) • CW = (Range) / (# classes) rounded up to precision of data • Select the smallest observed value as the lower limit of the first class and add multiples of the CW from step (2) to obtain the lower (not upper!) limits for each class • To find the upper class limits, add the CW to the lower class limits and subtract from this the precision of the data • So if the CW is 0.3 and the lower limit of the first class is 3.7, then the upper class limit for the first class is 3.7 + .3 -.1 = 3.9 • There is a gap between the upper limit of one class and the lower limit of the next; the gap width is the precision of the data • The class boundaries will be the midpoint of these gaps
1. Histograms Example 2.2 Histogram for Black Bear Data • In 2002, Katie Settlage and her field research team collected the following weights for female black bears in the southern Appalachians: where the weight is given in pounds. Let’s go through the steps of constructing a histogram for this set of data.
1. Histograms Example 2.2 Histogram for Black Bear Data • Decide on the number of classes (bars) for the histogram: This is small data set- 24 points- so we choose 6 classes • Determine the width of the classes (CW): CW = (Range) / (# classes) rounded up to precision of data = (150 – 38) / 6 = 18.66… => 19
1. Histograms Example 2.2 Histogram for Black Bear Data • Select the smallest observed value as the lower limit of the first class and add multiples of the CW from step (2) to obtain the lower (not upper!) limits for each class
1. Histograms Example 2.2 Histogram for Black Bear Data • Select the smallest observed value as the lower limit of the first class and add multiples of the CW from step (2) to obtain the lower (not upper!) limits for each class
1. Histograms Example 2.2 Histogram for Black Bear Data • Select the smallest observed value as the lower limit of the first class and add multiples of the CW from step (2) to obtain the lower (not upper!) limits for each class
1. Histograms Example 2.2 Histogram for Black Bear Data • To find the upper class limits, add the CW to the lower class limits and subtract from this the precision of the data
1. Histograms Example 2.2 Histogram for Black Bear Data • The class boundaries will be the midpoint of the gaps between the upper and lower boundaries
1. Histograms Example 2.2 Histogram for Black Bear Data • We need to count the frequencies for each class
1. Histograms Example 2.2 Histogram for Black Bear Data • Draw the histogram: The histogram seems to have two peaks- we say it is bimodal
1. Histograms Example 2.2 Histogram for Black Bear Data However, when classifying data as bimodal, we must be careful. Suppose we had chosen only four classes. We would have produced this histogram: This histogram appears to be unimodal.
1. Histograms Example 2.2 Histogram for Black Bear Data • Finally, we may also consider the relative frequencies for each class:
2. Scatter Plots Histograms vs Scatter Plots • Histograms are used to visually display single sets of measurements • In many cases however, the value obtained from a measurement is related to other characteristics or factors affecting the same object being measured; for example: • a child’s birth weight is related to the mother’s birth weight • leaf photosynthesis rate is affected by the light level • the number of eggs laid by a spider may be related to the size of the mother • The objective of a scatter plot is to determine visually whether there appears to be any relationship between two different observations or characteristics of a single biological object
2. Scatter Plots Creating Scatter Plots • Creating a scatter plot is easy once it is decided which characteristics are to be included • Each axis is chosen to cover the range of measurements for that observation set • One measurement is chosen for the horizontal axis and the other for the vertical- which is chosen for which axis which does not matter unless you have some reason to believe that one measurement causes changes in the other, in which case it is conventional to use the horizontal axis for the measurement that is viewed as the causative factor • Then for each object measured, a single point is plotted on the graph at the appropriate coordinates
2. Scatter Plots Creating Scatter Plots • For example, suppose we plot the number of eggs laid by vs the sizes (length in mm) of 38 different spiders:
2. Assignment • Exercises 2.2, 2.3, 2.4, 2.7, 2.9, 2.10
Homework 2.3 (a), (e) The length of time an outpatient must wait for treatment is a variable that plays an important part in the design of outpatient clinics. The waiting times (in minutes) for 50 patients at a pediatric clinic are as follows: Construct a histogram by hand using 5 classes. Solution: First, Determine the width of the classes (CW): CW = (Range) / (# classes) rounded up to precision of data = (108 – 6) / 5 = 20.4… => 21
Homework 2.3 (a), (e) Next, we fill in the table: Finally, draw the histogram:
Homework 2.3 (a), (e)
Homework 2.4 (b) The regulations of the Board of Health specify that the fluoride level in drinking water not exceed 1.5 parts per million (ppm). Each of the 11 measurements below represent average fluoride levels over 15 days in ppm. 0.75 0.86 0.84 0.97 0.94 0.89 0.88 0.78 0.77 0.76 0.82 (b) Construct a relative frequency histogram for this data using an appropriate number of classes (by hand). Solution: First, Determine the width of the classes (CW): CW = (Range) / (# classes) rounded up to precision of data = (0.97 – 0.75) / 4 = 0.055… => 0.06
Homework 2.4 Next, we fill in the table:
Homework 2.4 Finally, draw the histogram: