Download
1 / 21
210 likes | 334 Vues
NOPOLU System2. Large scale assessment of non-point nutrient sources. Surplus model principles. Statistics are available at administrative scale, often very aggregated, in any country

E N D
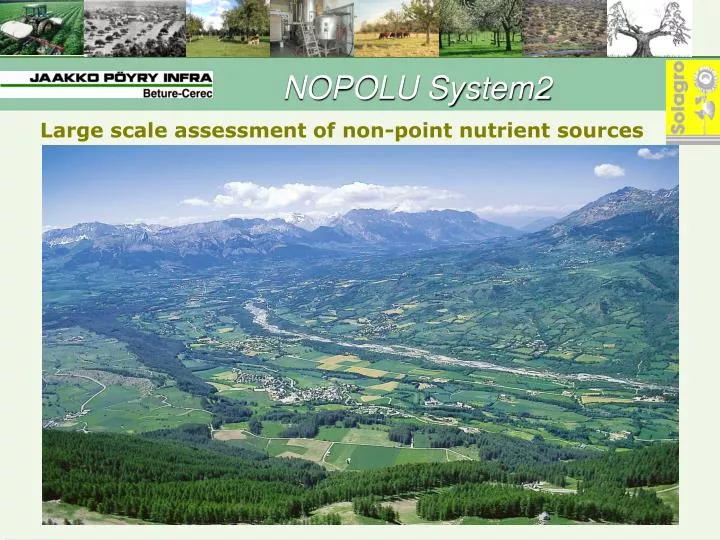
NOPOLU System2 Large scale assessment of non-point nutrient sources
Surplus model principles • Statistics are available at administrative scale, often very aggregated, in any country • Crops and livestock are grown / managed only on some type of land covers, crops and livestock types are under the Eurostat nomenclature, filters translate national nomenclatures. Relationships CLC types / land use are defined generally / locally • Mixing both yields spatial disaggregation of statistics, thus making it possible to calculate non-point source contribution. • Is a « statistically conceptual model »
Method of agricultural diffuse pollution evaluation with NOPOLU System2 • Calculation of yearly surplus of Nitrogen & Phosphorus, … • Desegregation of parameters from any NUTS level to any HYDROLOGIC level using a LAND COVER (CLC, remote sensing….) • Spatial statistics for all rates • Phenomenon modeled; • Symbiotic Fixation • Atmospheric deposition • Synthetic application fertilizers rates that can be modulate by organic fertilizer application • Volatilization of animals excreta in cattleshed, storing areas, pasture field,.. • Basic Data • Agricultural activities census (crop, animals,…) • Land cover • G.I.S. layer, NUTS & sub-catchments topology
+ Disaggregation using soil coverage Watersheds Limits Results at level basinor NUTS Scenarios Surpluses: Disaggregation method Census at NUTS level CLC
Livestock organic nitrogen output Whole France territory
Nitrogen sources Whole France • Organic excreta from livestock: 1487 kt • Synthetic fertilizer : 2 506 kt • Atmospheric deposition (EMEP 2000 source): • 670 kt (surface CLC - 14 kg/ha/an), • 430 kt (over arable land)
Symbiotic Fixation • Symbiotic Fixation : 569 kt
Results : Surplus (1 255 kt - 42 kg/ha) & Bilan (932 kt - 31 kg/ha)
Transfer modelling • Transfer modelling is be computed using: • Surplus values, slopes (at the sub-catchment level) and rainfall, flows, soil types determinants • Riverine loads calculation for calibration • Simple rules derived from physical processes. • Model type is « empirical based on lumped physical equations »
Results from emissions assessments, itself fuelled by agricultural surpluses modelling Results from monitoring networks, used for other purposes as well Example, OSPAR (Fluxes results)
Transparent Separate processes Responsive to hypothesis Surplus checked on all EU countries Non circular referencing Easily implemented and run Transfer easily appreciated with enough statistical data Evolutive Detailed processes non modelled, especially following the « data-driven » concept Transfer model could be more process oriented Many processes still unknown or impossible to calibrate Too rough rate spatial variation can introduce strong border difference. Pros & cons