Download
1 / 23
230 likes | 362 Vues
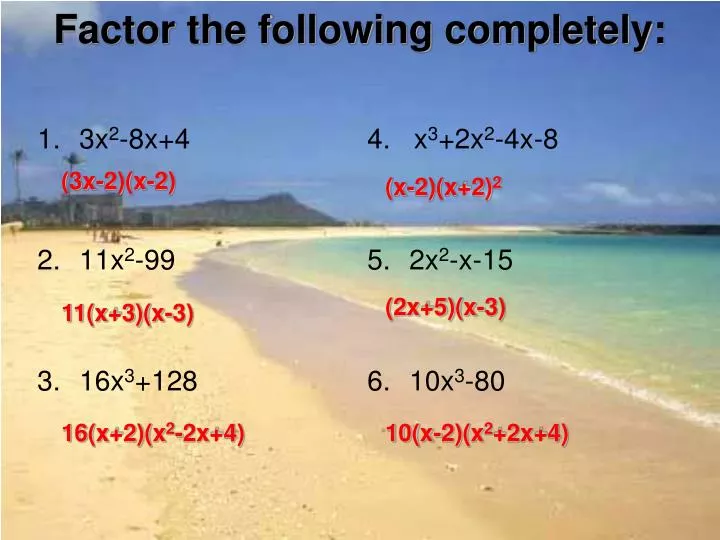
3x 2 -8x+4 11x 2 -99 16x 3 +128. 4. x 3 +2x 2 -4x-8 2x 2 -x-15 10x 3 -80. Factor the following completely:. (3x-2)(x-2). (x-2)(x+2) 2. (2x+5)(x-3). 11(x+3)(x-3). 16(x+2)(x 2 -2x+4). 10(x-2)(x 2 +2x+4). 5.3 Graph General Rational Functions. p. 319

E N D
3x2-8x+4 11x2-99 16x3+128 4. x3+2x2-4x-8 2x2-x-15 10x3-80 Factor the following completely: (3x-2)(x-2) (x-2)(x+2)2 (2x+5)(x-3) 11(x+3)(x-3) 16(x+2)(x2-2x+4) 10(x-2)(x2+2x+4)
5.3 Graph General Rational Functions p. 319 What information can you get from the equation of a rational graph? What is local minimum?
Yesterday, we graphed rational functions where x was to the first power only. What if x is not to the first power? Such as:
Steps to graph when x is not to the 1st power • Find the x-intercepts. (Set numer. =0 and solve) • Find vertical asymptote(s). (set denom=0 and solve) • Find horizontal asymptote. 3 cases: • If degree of top < degree of bottom, y=0 • If degrees are =, • If degree of top > degree of bottom, no horiz. asymp, but there will be a slant asymptote. • 4. Make a T-chart: choose x-values on either side & between all vertical asymptotes. • Graph asymptotes, pts., and connect with curves. • Check solutions on calculator.
6 Graph y = . State the domain and range. x2 + 1 The numerator has no zeros, so there is no x-intercept.The denominator has no real zeros, so there is no vertical asymptote. SOLUTION The degree of the numerator, 0, is less than the degree of the denominator, 2. So, the line y = 0 (the x-axis) is a horizontal asymptote. The graph passes through the points (–3, 0.6), (–1, 3), (0, 6), (1, 3), and (3, 0.6). The domain is all real numbers, and the range is 0 < y ≤ 6.
Ex: Graph. State domain & range. • x-intercepts: x=0 • vert. asymp.: x2+1=0 x2= -1 No vert asymp • horiz. asymp: 1<2 (deg. of top < deg. of bottom) y=0 4. x y -2 -.4 -1 -.5 0 0 1 .5 2 .4 (No real solns.)
Domain: all real #’s except -2 & 2 Range: all real #’s except 0<y<3
2x2 Graph y = . x2– 9 The numerator and denominator have the same degree, so the horizontal asymptote is y = am = = 2 bn 2 1 SOLUTION The zero of the numerator 2x2 is 0, so 0 is an x-intercept. The zeros of the denominator x2–9 are +3, so x = 3 and x = –3 are vertical asymptotes. Plot points between and beyond the vertical asymptotes.
Ex: Graph, then state the domain and range. • x-intercepts: 3x2=0 x2=0 x=0 • Vert asymp: x2-4=0 x2=4 x=2 & x=-2 • Horiz asymp: (degrees are =) y=3/1 or y=3 • x y • 4 4 • 3 5.4 • 1 -1 • 0 0 • -1 -1 • -3 5.4 • -4 4 On right of x=2 asymp. Between the 2 asymp. On left of x=-2 asymp.
Domain: all real numbers Range:
x2 +3x – 4 Graph y = . x – 2 SOLUTION The numerator factors as (x + 4)(x –1), so the x-intercepts are – 4 and 1. The zero of the denominatorx– 2 is 2, so x = 2 is a vertical asymptote. The degree of the numerator, 2, is greater than the degree of the denominator, 1,so the graph has no horizontal asymptote. The graph has the same end behavior as the graph of y = x2–1 = x. Plot points on each side of the vertical asymptote.
Ex: Graph, then state the domain & range. • x-intercepts: x2-3x-4=0 (x-4)(x+1)=0 x-4=0 x+1=0 x=4 x=-1 • Vert asymp: x-2=0 x=2 • Horiz asymp: 2>1 (deg. of top > deg. of bottom) no horizontal asymptotes, but there is a slant! • x y • -1 0 • 0 2 • 1 6 • 3 -4 • 4 0 Left of x=2 asymp. Right of x=2 asymp.
Slant asymptotes • Do synthetic division (if possible); if not, do long division! • The resulting polynomial (ignoring the remainder) is the equation of the slant asymptote. In our example: 2 1 -3 -4 1 -1 -6 Ignore the remainder, use what is left for the equation of the slant asymptote: y=x-1 2 -2
Domain: all real #’s except 2 Range: all real #’s
A food manufacturer wants to find the most efficient packaging for a can of soup with a volume of 342 cubic centimeters. Find the dimensions of the can that has this volume and uses the least amount of material possible. Manufacturing
V= r2h 342= r2h 342 = h r2 SOLUTION STEP 1 Write an equation that gives the height hof the soup can in terms of its radius r. Use the formula for the volume of a cylinder and the fact that the soup can’s volume is 342 cubic centimeters. Formula for volume of cylinder Substitute 342 for V. Solve for h.
342 r2 π Substitute for h. STEP 2 Write a function that gives the surface area Sof the soup can in terms of only its radius r. Formula for surface area of cylinder Simplify.
You get a minimum value of about 271,which occurs when r3.79 and 342 h 7.58. π (3.79)2 STEP 3 Graph the function for the surface area Susing a graphing calculator. Then use the minimumfeature to find the minimum value of S. ANSWER So, the soup can using the least amount of material has a radius of about 3.79 centimeters and a height of about 7.58 centimeters. Notice that the height and the diameter are equal for this can.
What information can you get from the equation of a rational graph? X-intercept from setting the numerator=0 Vertical asymptotes from setting the denominator = 0 If m<n, the horizontal asymptote is y = 0 If m=n, the horizontal asymptote is y =coefficient of numerator/coefficient of denominator If m>n, there is no horizontal asymptote • What is local minimum? Tells where the most efficient solution is in application problems.
5.3 Assignment p. 322 3-6, 4-19 odd People with graphing calculators must show a table and plot the points in the table.