Download
1 / 24
250 likes | 575 Vues
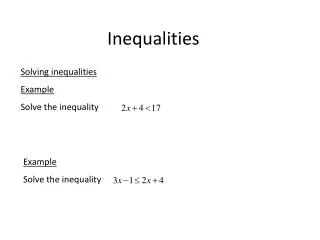
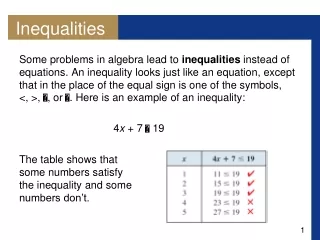
Inequalities. Solving and Graphing. Graphing Inequalities. –4.75. –5. –4.5. Graphing Inequalities. 1. Describe the solutions of 7 < x + 4. . all real numbers greater than 3. 2. Graph h ≥ –4.75. Write the inequality shown by each graph. x ≥ 3. 3. x < –5.5. 4.

E N D
Inequalities Solving and Graphing
–4.75 –5 –4.5 Graphing Inequalities 1. Describe the solutions of 7 < x + 4. all real numbers greater than 3 2. Graph h ≥ –4.75 Write the inequality shown by each graph. x ≥ 3 3. x < –5.5 4.
INEQUALITIES – SOLVING/GRAPHING Four students graphed the inequality 4 > b. Which describes the best solution? A) An open line/circle at 4 shaded to the right B) A closed line/circle at 4 shaded to the left C) An open line/circle at 4 shaded to the left D) A closed line/circle at 4 shaded to the right
INEQUALITIES – SOLVING/GRAPHING Solve and graph the inequality:
INEQUALITIES – SOLVING/GRAPHING Write an inequality to represent each relationship, then solve and graph: a. Four more than twice a number is at least sixteen. b. Three-fourths of a number is less than twelve.
INEQUALITIES – SOLVING/GRAPHING If a – b > a + b, which statement is true? A)The value of a is positive B) The value of a is negative C) The value of b is positive D) The value of b is negative
INEQUALITIES – SOLVING/GRAPHING Which is a solution of the inequality 7(2 – x)>4(x – 2)? A) -2 B) 2 C) 4 ` D) 7
Linear Inequalities –solve and graph Tell whether the ordered pair is a solution of the inequality: (0, 3); y ≤ -x +3 (-2, 1); y < 2x + 4
Linear Inequalities –solve and graph Stephen wants to buy yellow tangs and clown fish for his aquarium. He can spend no more than $77 on fish. Yellow tangs cost $15 each and clown fish cost $11 each. Write an inequality to represent the number of tangs (x) and clown fish (y) that he could purchase.
Solve the inequality for y (slope-intercept form). Step 1 Graph the boundary line (the related equation). Use a solid line for ≤ or ≥. Use a dashed line for < or >. Step 2 Shade the half-plane above the line for y > or ≥. Shade the half-plane below the line for y < or y ≤. Check your answer. Step 3 Graphing Linear Inequalities
Graphing Inequalities y 2x –3 Step 1 The inequality is already solved for y. Step 2 Graph the boundary line y = 2x – 3. Use a solid line for . Step 3 The inequality is , so shade below the line.
Linear Inequalities –solve and graph Graph each inequality on a separate coordinate plane (remember to shade!) y > 2x + 6
Linear Inequalities –solve and graph Graph each inequality on a separate coordinate plane (remember to shade!) x ≤ 2
Linear Inequalities –solve and graph Graph each inequality on a separate coordinate plane (remember to shade!) 3x + 2y ≥ 6
Compound Inequalities Solve each compound inequality and graph the solutions. 2 ≤ 2w + 4 ≤ 12 –1 ≤ w ≤ 4 3 + r > −2 OR 3 + r < −7 r > –5 OR r < –10
Compound Inequalities Write the compound inequality shown by each graph. x < −7 OR x ≥ 0 −2 ≤ a < 4
Compound Inequalities The target heart rate during exercise for a 15 year-old is between 154 and 174 beats per minute inclusive. Write a compound inequality to show the heart rates that are within the target range. Graph the solutions. 154 ≤ h ≤ 174
Graphing Inequality Systems To show all the solutions of a system of linear inequalities, graph the solutions of each inequality. The solutions of the system are represented by the overlapping shaded regions.
y ≤ 3 y > –x + 5 Graphing Inequality Systems Graph the system of linear inequalities. Give two ordered pairs that are solutions and two that are not solutions.
–3x + 2y ≥2 y < 4x + 3 Graphing Inequality Systems Graph the system of linear inequalities. Give two ordered pairs that are solutions and two that are not solutions.
Graphing Inequality Systems Graph the system of linear inequalities. Give two ordered pairs that are solutions and two that are not solutions. y ≤ x + 1 y > 2
Graphing Inequality Systems Graph the system of linear inequalities. Give two ordered pairs that are solutions and two that are not solutions. y > x – 7 3x + 6y ≤ 12