Download
1 / 15
150 likes | 307 Vues
Example of SIMONE Network Manager Integration Plinacro project description. PLINACRO Project – Basic facts. Croatian national gas transport network Coveres northern part, from east to west, with tendency of expanding to whole teritory of Croatia Complex topology – loops, parallel lines

E N D
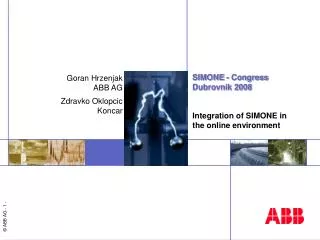
Example of SIMONE Network Manager IntegrationPlinacro project description
PLINACRO Project – Basic facts Croatian national gas transport network • Coveres northern part, from east to west, with tendency of expanding to whole teritory of Croatia • Complex topology – loops, parallel lines • Different pipeline characteristics (diameter, length, roughness, altitude profile, etc.) • Complex technology – different pressure levels (75, 50, 20, .. bar), regulation nodes, etc. • Large number of off-take stations – appr. 140 from very small to very large • Gas supplied from domestic gas production (20 in-take stations) and from import (1 border in-take station) • More than 150 distribution networks and direct industrial consumers connected to Plinacro gas network • Underground gas storage OKOLI used to compensate for seasonal and short-term gas consumption variation
PLINACRO Project – Basic facts / cont. Plinacro SCADA system • ABB Network Manager • 2 SCADA servers, • 2 UDW servers, • 1 DE server, • 1 web server, • 1 GIS/TIS server • 3 operator workstations • 2 DE workstation • Private communication network (microwave and UHV radio, fiber optic) • 66 RTUs connecting dispatching centre with: • appr. 30 major off-take stations • 7 major in-take stations • 9 regulating nodes • 1 underground gas storage • block stations, etc. • Special functions subsystem featuring • Load forecasting • Realtime simulation • Leak detection and localization • Look-ahead simulation • Predictive simulation • Application modules
External data sources Gas meter readings (manual operation) • Hourly metered values are recorded locally in gas meters or data loggers • Periodically, recorded values are uploaded in PC and sent (or brought) to dispatching center • Collected data is stored in MS Access database • MS Access application enables: data analysis, reporting, aggregation and UDW update • Data stored in UDW by gas consumer (instead of by individual meter lines) Nominations • Nominations sent by gas shipper INA for: • Gas production (20 in-take points) • Gas import (1 in-take point) • Special consumers (power plants, petrochemistry, sugar factories) • Hourly profiles stored in XML files which are sent to Plinacro • In Plinacro, received XML files are used to update UDW • Same application used by Plinacro to create hourly profiles for underground storage Meteo data • Weather forecast for 2 variables (temperature, cloudness) on 6 locations received twice per day (flat ascii file received by ftp) • Forecast consists of 174 hourly values, starting from 01:00 or 13:00 hours of current day • Weather history received periodically for longer time period (eg. per month) • Received meteo data stored in MS Access database, and after that sent to UDW
Load forecasting Special consumers (power plants, petrochemistry, sugar factories) • Shipper INA sends monthly nominations, which can be updated daily • Stepwise curves, received in XML files, stored in UDW • Operators are able to change contents of XML files Large distribution networks and direct industrial consumers • Special program LOAD FORECAST used for load prediction • Load forecast run twice a day • Forecasting method: Kalman filter, exponential smoothing • Input data stored in UDW in the form of hourly time series data: • Previous day online gas counter reading history • Previous day weather history • Medium term weather forecast • 2 weather parameters (air temperature and cloudness) and type of day used as influence variables • Currently, weather forecast is used to create weather history! • Load forecast stored in UDW in the form of hourly time series data Small nontelemetered distribution networks and direct industrial consumers • Constant load • Updated periodically – average historic values derived from manual meter readings
SIMONE – gas network model • Basis for all SIMONE applications • Developed in SIMONE TOPO editor tool • ALL pipelines included • Real altitude profiles entered • Default pipe wall roughness entered (additional tuning necessary) • ALL off-take stations • ALL in-take stations • Switching elements (valves) for occasional topology modification – online or manual • Control elements (pressure and flow regulators) • “Star-like” regulating nodes – customization for Plinacro • Different gas qualities on in-take points
SIMONE realtime execution • State reconstruction and Leak detection controled by Cycle control program • Basic cycle length 3 min. • In data preparation phase 266 flows, pressures and other values imported from NM • After reconstruction run some calculated values are exported to NM • User can view ALL calculated values in SIMONE GUI (different ways) • Some calculated values can be viewed in NM environment
SIMONE look-ahead run • Look-ahead simulation execution controled by Cycle control program • Look-ahead cycle length - 3 min. • In data preparation phase boundary flow profiles are imported from NM • Special initial scenario is prepared and updated regularly for nontelemetered consumers • Initial state – estimated network state taken from realtime run • Setpoint values retain actual values from realtime run and stay constant during whole period of simulation • Simulation interval – 24 hours in advance from actual time • User can view ALL calculated values ONLY in SIMONE GUI
SIMONE Status export to NM • Status information in the form of numerical variables after each state reconstruction run exported to NM • Special SPL program in NM analyses received values and updates corresponding data points in AVANTI database • Operators can view information on special picture • Calculated values are processed and, if appropriate, entered in event or alarm list
SIMONE and ABB NM Integration - Future • Load forecasting improvement • Forecasting of nontelemetered consumers – additional program for load forecasting • Integration of TeleReading system and using Load Forecast program for all consumers • Using own measurements of weather parameters • Redundancy support improvement – in progress • Export of Look-ahead simulation results in NM • Online “What-If” studies to support network operators • Improvement of Simone system status export in NM • Opimization when compressor station is installed.