Download
1 / 37
370 likes | 375 Vues
Perfect Competition in the Market for Organic Apples. LEARNING Objectives. The process of competition is at the heart of the market system and is the focus of this chapter. Firms in Perfectly Competitive Markets. Table 8-1. The Four Market Structures. Learning Objective 8.1.

E N D
Perfect Competition in the Market for Organic Apples LEARNING Objectives The process of competition is at the heart of the market system and is the focus of this chapter.
Firms in Perfectly Competitive Markets Table 8-1 The Four Market Structures
Learning Objective 8.1 Perfectly Competitive Markets Perfectly competitive market A market that meets the conditions of (1) many buyers and sellers, (2) all firms selling identical products, and (3) no barriers to new firms entering the market. A Perfectly Competitive Firm Cannot Affect the Market Price Price taker A buyer or seller that is unable to affect the market price.
Learning Objective 8.1 Perfectly Competitive Markets The Demand Curve for the Outputof a Perfectly Competitive Firm FIGURE 8-1 A Perfectly Competitive Firm Faces a Horizontal Demand Curve
Learning Objective 8.1 Perfectly Competitive Markets The Demand Curve for the Outputof a Perfectly Competitive Firm FIGURE 8-2 The Market Demand for Wheat versus the Demand for One Farmer’s Wheat Don’t Let This Happen to YOU!Don’t Confuse the Demand Curve for Farmer Parker’s Wheat with the Market Demand Curve for Wheat
Learning Objective 8.2 How a Firm Maximizes Profit in a Perfectly Competitive Market Profit Total revenue minus total cost. Profit = TR – TC Revenue for a Firm in a Perfectly Competitive Market Average revenue (AR) Total revenue divided by the quantity of the product sold. Marginal revenue (MR) Change in total revenue from selling one more unit of a product.
Learning Objective 8.2 How a Firm Maximizes Profit in a Perfectly Competitive Market Revenue for a Firm in a Perfectly Competitive Market Table 8-2 Farmer Parker’s Revenue from Wheat Farming
Learning Objective 8.2 How a Firm Maximizes Profit in a Perfectly Competitive Market Determining the Profit-Maximizing Level of Output Table 8-3 Farmer Parker’s Profits from Wheat Farming
Learning Objective 8.2 How a Firm Maximizes Profit in a Perfectly Competitive Market Determining the Profit-Maximizing Level of Output FIGURE 8-3 The Profit-Maximizing Level of Output
Learning Objective 8.2 How a Firm Maximizes Profit in a Perfectly Competitive Market Determining the Profit-Maximizing Level of Output From the information in Table 8-3 and Figure 8-3, we can draw the following conclusions: 1 The profit-maximizing level of output is where the difference between total revenue and total cost is the greatest. 2 The profit-maximizing level of output is also where marginal revenue equals marginal cost, or MR = MC.
Learning Objective 8.3 Illustrating Profit or Loss on the Cost Curve Graph Profit = (P x Q) TC or Profit = (PATC)Q
Learning Objective 8.3 Illustrating Profit or Loss on the Cost Curve Graph Showing a Profit on the Graph FIGURE 8-4 The Area of Maximum Profit
Learning Objective 8.3 8-3 Solved Problem Determining Profit-Maximizing Price and Quantity
Learning Objective 8.3 Illustrating Profit or Loss on the Cost Curve Graph Don’t Let This Happen to YOU!Remember That Firms Maximize Total Profit, Not Profit per Unit
Learning Objective 8.3 Illustrating Profit or Loss on the Cost Curve Graph Illustrating When a Firm Is Breaking Evenor Operating at a Loss 1P > ATC, which means the firm makes a profit. 2P = ATC, which means the firm breaks even (its total cost equals its total revenue). 3P < ATC, which means the firm experiences losses.
Learning Objective 8.3 Illustrating Profit or Loss on the Cost Curve Graph Illustrating When a Firm Is Breaking Evenor Operating at a Loss FIGURE 8-5 A Firm Breaking Even and a Firm Experiencing Losses
Learning Objective 8.3 MakingtheConnection • Losing Money in the Medical Screening Industry
Learning Objective 8.4 Deciding Whether to Produceor to Shut Down in the Short Run In the short run, a firm suffering losses has two choices: 1 Continue to produce 2 Stop production by shutting down temporarily Sunk cost A cost that has already been paid and that cannot be recovered.
Learning Objective 8.4 MakingtheConnection • When to Close a Laundry Keeping a business open even when suffering losses can sometimes be the best decision for an entrepreneur in the short run.
Learning Objective 8.4 Deciding Whether to Produce or to Shut Down in the Short Run The Supply Curve of a Firm in the Short Run Total revenue < Variable cost, or, in symbols: P × Q < VC If we divide both sides by Q, we have the result that the firm will shut down if: P < AVC Shutdown point The minimum point on a firm’s average variable cost curve; if the price falls below this point, the firm shuts down production in the short run.
Learning Objective 8.4 Deciding Whether to Produce or to Shut Down in the Short Run The Supply Curve of a Firm in the Short Run FIGURE 8-6 The Firm’s Short-Run Supply Curve
Learning Objective 8.4 Deciding Whether to Produce or to Shut Down in the Short Run The Market Supply Curve in a Perfectly Competitive Industry FIGURE 8-7 Firm Supply and Market Supply
Learning Objective 8.5 “If Everyone Can Do It, You Can’t Make Money at It”: The Entry and Exit of Firms in the Long Run Economic Profit and the Entry or Exit Decision Table 8- 4 Farmer Moreno’s Costs per Year Economic profit A firm’s revenues minus all its costs, implicit and explicit.
Learning Objective 8.5 “If Everyone Can Do It, You Can’t Make Money at It”: The Entry and Exit of Firms in the Long Run Economic Profit and the Entry or Exit Decision Economic Profit Leads to Entry of New Firms FIGURE 8-8 The Effect of Entry on Economic Profits
Learning Objective 8.5 “If Everyone Can Do It, You Can’t Make Money at It”: The Entry and Exit of Firms in the Long Run Economic Profit and the Entry or Exit Decision Economic Losses Lead to Exit of Firms FIGURE 8-9 The Effect of Exit on Economic Losses
Learning Objective 8.5 “If Everyone Can Do It, You Can’t Make Money at It”: The Entry and Exit of Firms in the Long Run Economic Profit and the Entry or Exit Decision Economic Losses Lead to Exit of Firms FIGURE 8-9 The Effect of Exit on Economic Losses (continued)
Learning Objective 8.5 “If Everyone Can Do It, You Can’t Make Money at It”: The Entry and Exit of Firms in the Long Run Economic Profit and the Entry or Exit Decision Economic Losses Lead to Exit of Firms Economic loss The situation in which a firm’s total revenue is less than its total cost, including all implicit costs. Long-Run Equilibrium in a Perfectly Competitive Market Long-run competitive equilibrium The situation in which the entry and exit of firms has resulted in the typical firm breaking even.
Learning Objective 8.5 “If Everyone Can Do It, You Can’t Make Money at It”: The Entry and Exit of Firms in the Long Run The Long-Run Supply Curve in a Perfectly Competitive Market FIGURE 8-10 The Long-Run Supply Curve in a Perfectly Competitive Industry
Learning Objective 8.5 “If Everyone Can Do It, You Can’t Make Money at It”: The Entry and Exit of Firms in the Long Run The Long-Run Supply Curve in a Perfectly Competitive Market Long-run supply curve A curve that shows the relationship in the long run between market price and the quantity supplied. Increasing-Cost and Decreasing-Cost Industries Industries with upward-sloping long run supply curves are called increasing-cost industries. Industries with downward-sloping long-run supply curves are called decreasing-cost industries.
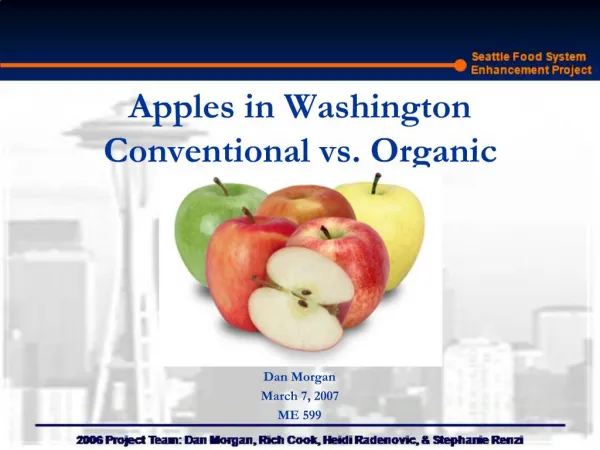
Learning Objective 8.6 MakingtheConnection • The Decline of Apple Production in New York State When apple growers in New York State stopped breaking even, many sold their land to housing developers.
Learning Objective 8.6 Perfect Competition and Efficiency Productive Efficiency Productive efficiency The situation in which a good or service is produced at the lowest possible cost.
Learning Objective 8.6 8-6 Solved Problem How Productive Efficiency Benefits Consumers
Learning Objective 8.6 Perfect Competition and Efficiency Allocative Efficiency Firms will supply all those goods that provide consumers with a marginal benefit at least as great as the marginal cost of producing them. 1 The price of a good represents the marginal benefit consumers receive from consuming the last unit of the good sold. 2 Perfectly competitive firms produce up to the point where the price of the good equals the marginal cost of producing the last unit. 3 Therefore, firms produce up to the point where the last unit provides a marginal benefit to consumers equal to the marginal cost of producing it.
Learning Objective 8.6 Perfect Competition and Efficiency Allocative Efficiency Allocative efficiency A state of the economy in which production represents consumer preferences; in particular, every good or service is produced up to the point where the last unit provides a marginal benefit to consumers equal to the marginalcost of producing it.
Why Are Organic Farmers Worried about Wal-Mart? LOOK An Inside Wal-Mart’s Organic Offensive
K e y T e r m s Perfectly competitive market Price taker Productive efficiency Profit Shutdown point Sunk cost Allocative efficiency Average revenue (AR) Economic loss Economic profit Long-run competitive equilibrium Long-run supply curve Marginal revenue (MR)