Download
1 / 17
220 likes | 720 Vues
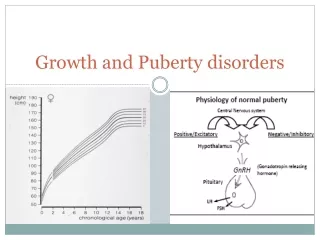
Understanding growth and puberty using the RCPCH UK 2-18 growth charts. Why measure school aged children?. Growth is best indicator of health Demonstration of normality of growth by age and stage of puberty Identify disorders of growth Assess obesity. Key questions.

E N D
Understanding growth and puberty using the RCPCH UK 2-18 growth charts
Why measure school aged children? Growth is best indicator of health Demonstration of normality of growth by age and stage of puberty Identify disorders of growth Assess obesity
Key questions Is a child too short or tall for their age – could there be a problem? Has puberty started and is it progressing normally? Is growth normal for stage of puberty? Is this child overweight or obese?
The new UK 2-18 charts will help you answer these questions Developed and published by RCPCH Based on updated UK 1990 growth references New design features: Puberty Phases BMI lookup and plotting grid Parental height comparator Adult height prediction
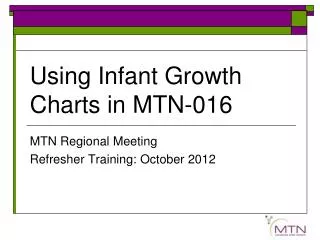
RCPCH UK 2-18 Growth chart Parent height comparator Mid parental centile scale UK90 reference after age 4 WHO standards until age 4 Predicted adult height scale Birth centiles
x Using the Adult Height Predictor Use an X to mark the child’s most recent height centile in the centre line Read off the child’s estimated adult height from right scale 80% of children will be within ±6 cm of this value Scale also shown in feet and inches on left
Mid parental Centile = 75th Using the Parent Height Comparator Mark mother’s height on the left hand scale and father’s height on the right scale using arrows Draw a line between arrowheads and read off mid-parental centile where this crosses the central line Regression adjustment means that children of very short or tall parents have mid parental centile nearer to average than expected
Using the Parent Height Comparator Compare the mid-parental centile to the child’s current height centile (x) Nine out of ten children’s height centiles are within ±two centile spaces of the mid-parental centile Only 1 percent more than three centile spaces below Mid parental centile = 75th X within parental range X < 5% children < 1% children X
Interpretation of the mid-parental height centile (MPHC) Average centile for all children of these parents Compare to child’s actual height centile Most children are within ±two centile spaces of the mid-parental centile Only 1 percent more than three centile spaces below Most have no treatable cause for their short stature, Investigate further if other concerns about the child’s growth NB a child growing abnormally may still be within mid-parental height range
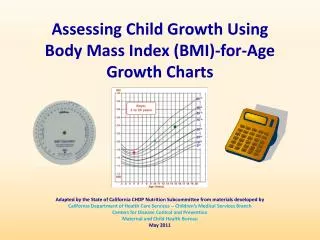
Body Mass Index (BMI) lookup BMI = 91st centile • Read weight and height centiles from the growth chart. • Plot weight centile (left axis) against the height centile (bottom axis) • Read off the corresponding BMI centile from the slanting lines • Record centile on grid at top of chart • Accurate to ¼ centile space
BMI centile grid: plotting example >91st centile suggestsoverweight >98th centile is very overweight (clinically obese)
BMI Interpretation A child whose weight is average for their height will have a BMI between the 25th and 75th centiles < 2nd centile may reflect undernutrition, but may simply reflect a small frame or low muscle mass But BMI often varies from one measurement to the next due to measurement error Compare BMI to weight and height centiles using BMI plotting grid at top of chart
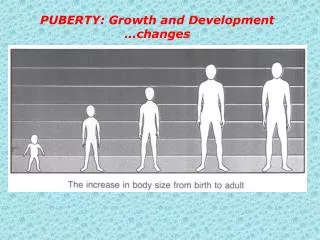
Pre-puberty ONLY Puberty starting before 8 is precocious Growth during Puberty Plotting pubertal children on the UK 2-18 Growth charts
Puberty section of new 2-18 Chart Most healthy children start puberty between these ages Puberty Lines Most healthy children complete puberty between these ages • Puberty Lines mark boundaries of normal pubertal development • Shaded zone marks area where 0.4th centile varies with phase of puberty
Shaded Puberty Zone • Marks area where 0.4th centile varies with phase of puberty • Heights in the shaded area below the 0.4th centile: • Pre-puberty: if within 2 centiles of Mid-Parental Height = within the normal range • In or Completing puberty = below normal range
Summary: 2-18 charts will help you assess The phases of puberty and how to use them to interpret growth charts Predict adult height and relate a child’s height to the parents’ height Assess BMI without a calculator