Download
1 / 11
110 likes | 290 Vues
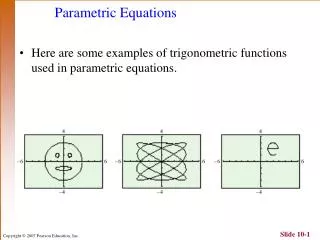
Parametric Equations. This is the ball’s horizontal distance, in feet. This is the ball’s vertical height, in feet. Plane Curves and Parametric Equations.

E N D
This is the ball’s horizontal distance, in feet. This is the ball’s vertical height, in feet. Plane Curves and Parametric Equations You throw a ball from a height of 6 feet, with an initial velocity of 90 feet per second and at an angle of 40º with the horizontal. After t seconds, the path of the ball can be described by x = (90 cos 40º)t and y = 6 + (90 cos 40º)t – 16t2. Using these equations, we can calculate the location of the ball at any time t. For example, to determine the location when t = 1 second, substitute 1 for t in each equation: x = (90 cos 40º)(1) 68.9 feet. y = 6 + (90 cos 40º)(1) – 16 (1)2 47.9 feet.
t= 1 sec x= 68.9 ft y= 47.9 ft t= 2 sec x= 137.9 ft y= 57.7 ft t= 3 sec x= 206.8 ft y= 35.6 ft y (feet) 60 40 20 x (feet) 40 80 120 160 200 240 Plane Curves and Parametric Equations This tells us that after 1 second, the ball has traveled a horizontal distance of approximately 68.9 feet, and the height of the ball is approximately 47.9 feet. The figure below displays this information and the results for calculations corresponding to t = 2 seconds and t = 3 seconds.
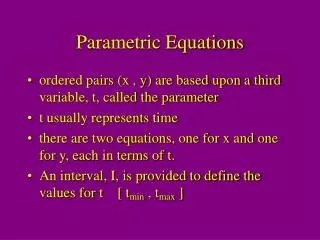
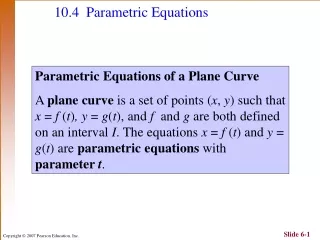
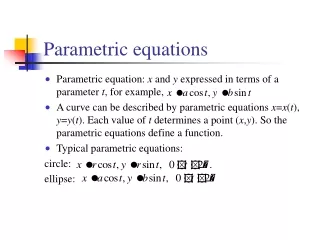
Plane Curves and Parametric Equations • Suppose that t is a number in an interval I. A plane curve is the set of ordered pairs (x, y), where • x = f (t), y = g(t) for t in interval I. • The variable t is called a parameter, and the equations x = f (t) and y = g(t) are called parametric equations for this curve.
Graphing a Plane Curve Described by Parametric Equations • Select some values of t on the given interval. • For each value of t, use the given parametric equations to compute x and y. • Plot the points (x, y) in the order of increasing t and connect them with a smooth curve.
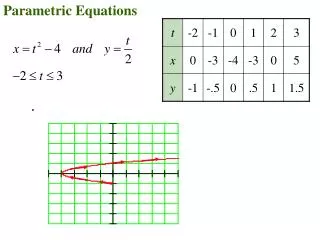
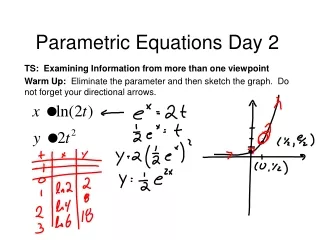
Solution Step 1 Select some values of t on the given interval. We will select integral values of t on the interval -2 <t< 2. Let t = -2, -1, 0, 1, and 2. Text Example Graph the plane curve defined by the parametric equations x = t2 – 1, y = 2t, -2 <t< 2. Step 2 For each value of t, use the given parametric equations to compute x and y. We organize our work in a table. The first column lists the choices for the parameter t. The next two columns show the corresponding values for x and y. The last column lists the ordered pair (x, y).
t= 2, (3, 4) t= 1, (0, 2) t x = t2 – 1 y = 2 t (x, y) 5 4 -2 (-2)2 – 1 = 4 – 1 = 3 2(-2) = -4 (3, -4) 3 2 -1 (-1)2 – 1 = 1 – 1 = -2 2(-1) = -2 (0, -2) 1 -5 -4 -3 -2 -1 1 2 3 4 5 0 02 – 1 = 0 – 1 = -1 2(0) = 0 (-1, 0) -1 -2 t= 0, (-1, 0) -3 1 12 – 1 = 1 – 1 = 0 2(1) = 2 (0, 2) -4 -5 t= -1, (0, -2) 2 22 – 1 = 4 – 1 = 3 2(2) = 4 (3, 4) t= -2, (3, -4) Text Example Solution Step 3 Plot the points (x, y) in the order of increasing t and connect them with a smooth curve. The plane curve defined by the parametric equations on the given interval is shown. The arrows show the direction, or orientation, along the curve as t varies from –2 to 2.
Parametric Equations for the Function y = f(x) A set of parametric equation for the plane curve defined by y = f (x) is x = t and y = f (t) in which t is in the domain of f.
Example • Graph the plane curve defined by the parametric equations x = 3t, y = t2+4, -3 < t < 3 Solution:
Example cont. • Graph the plane curve defined by the parametric equations x = 3t, y = t2+4, -3 < t < 3