Download
1 / 46
460 likes | 763 Vues
Simulation Tool Selection Methodology. Koushik Arunachalam, PE Jody Peace, EIT. Health and Safety Moment. Presentation Outline. Need for Simulation Overview of 3 Tier Modeling Approach Simulation Tool Selection – A Project Based Approach Summary, Q/A. Need For Simulation.

E N D
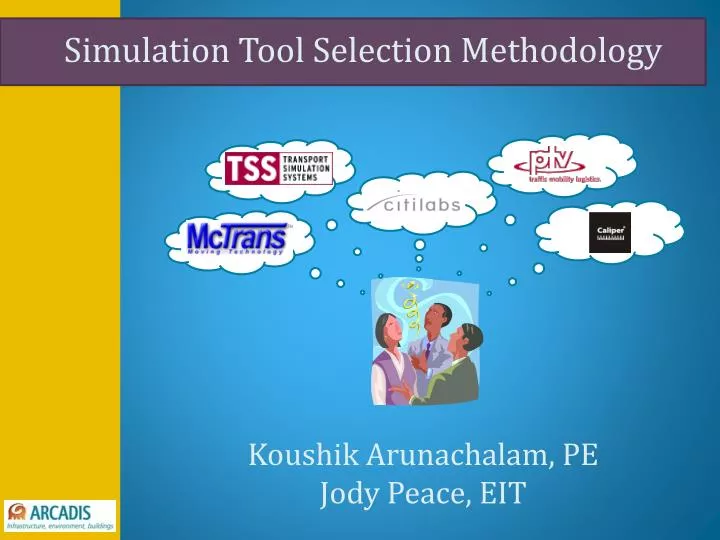
Simulation Tool Selection Methodology Koushik Arunachalam, PE Jody Peace, EIT
Presentation Outline Need for Simulation Overview of 3 Tier Modeling Approach Simulation Tool Selection – A Project Based Approach Summary, Q/A
Need For Simulation • Limitations of analytical approach – A deterministic approach • Inability to analyze system / network effects • Scale and complexity of the networks • Applicability to unconventional network configurations • Unlimited combination of events • Ability to analyze multiple “what-if” scenarios • Public outreach • Why not?
Tier -1 Macroscopic Simulation MC ARC Envision6 Level of Service (LOS) Chart • OPERATIONAL OUTPUTS: • Link Level Demand • Origin Destination (OD) Matrix Originally designed to estimate demand for major highway improvements included in regional long-range plans Large networks, limited detail Ability to complete all 4-steps in modeling process Allows for v/c greater than 1 Travel time and speed determined by delay curves Demand matrix is unique for specific time periods and modes
Tier -3 Microscopic Simulation MI • Designed to evaluate actual traffic operations • Functions based on a number of behavioral models: • Car-following model • Lane-changing • Yielding • Gap acceptance models • Route choice models for DTA • Best suited to evaluate operational and management strategies to address congestion • Extremely detail oreinted process VISSIM SNAPSHOT: I-75/85 at I-20 OPERATIONAL OUTPUTS: • Speed • Density • Throughput (Volume) • Post-Processing Data • Queues • Travel time • Delay • 2-D, 3-D Visualization
Microscopic Simulation - Video MI Haverhill Rd Video
Need to Bridge the GAP TIER 1 - MACRO TIER 2 - MESO TIER 3 – MICRO
Tier -2: Mesoscopic Simulation ME MEZZO SNAPSHOT* • OPERATIONAL OUTPUTS: • Speed • Throughput (Volume) • Travel time • Delay • Best suited for larger networks – a balance between planning and operational models • Individual vehicles with aggregate behavior - Cell Transmission technique • Explicit treatment of interrupted flows • Capture effects of capacity limitations & queue spillback • Route choice based on Speed – Density relationship • Dynamic Traffic Assignment (DTA) based on equilibrium assignment • Time sliced demand matrix to replicate time varying demand • Approaches microscopic with simple networks and macroscopic with complex networks * Source: Centre for Traffic Research, Stockholm
Mesoscopic Simulation - Video ME Mezzo Example Network Source: Centre for Traffic Research, Stockholm
Operational Merits and Demerits of Individual Modeling Approach
Simulation Tools – Applicability to 3 Tier Modeling Macro Meso Micro AIMSUN CORSIM Cube Avenue Cube Voyager DynaSMART / DynaMIT Mezzo Paramics SimTraffic TransCAD TransModeler VISSIM VISUM
Game Time I have a complete tool box, which tool should I use ?
Simulation Tool Selection – FHWA Criteria’s Geographic Scope Facility Type Travel Mode Management Strategy Travelers Response Performance Measures Tool / Cost-Effectiveness Source: Traffic Analysis Toolbox, PUBLICATION NO. FHWA-HRT-04-039
Simulation Tool Selection – Criteria’s Source: Traffic Analysis Toolbox, PUBLICATION NO. FHWA-HRT-04-039
Network Size - Breadth Assessment R E G I O N A L Network size M E T R O A T L AN T A CORRIDOR I NTERCHANGE Macroscopic Mesoscopic Micro Macro Macroscopic
Project Complexity – Depth Assessment • Breadth to Depth transition • Level of detail • Intersection(s) / Interchange • Corridor • System / Network • Tool selection based on depth • Static route? • Are there parallel routes – Need for dynamic route choice? • Is there need to model specific vehicle type? • What kind of traffic data do I have ? OD – Turning movements • Any change in travel pattern? – New access points • Saturated versus low-moderate congestion?
Level - Intersection (s) / Interchange Potential Projects: • Turn lane improvements • Interchange improvements – CFI, Diverging diamond, Signal to Loop • Slip lane from/to Interstate ramps • Merge / Diverge improvements • Widening in sections– 2 to 4 lanes Understanding the impacts: • Localized effects • Queuing, Delays, Crashes – Operational Issues • Change in travel pattern - Insignificant Our Approach: • One level modeling – Microscopic simulation • Tools: Synchro / Simtrafic, Corsim
An Example Continuous Flow Intersection
Level - Corridor Potential Projects: • Collector Distributor System between 2-3 interchanges • New interchange access • “Reliever” / Local By-pass Projects • Auxiliary lane between interchange Understanding the impacts: • Potential change in travel pattern • Effects not local, spreads to competing / parallel routes • Increase in demand due to added capacity • Need for Dynamic Traffic Assignment (DTA) - Optional Our Approach: • Two level modeling – Macro-Micro • Tools: Cube - Synchro - Corsim Visum - Synchro - Vissim
An Example I-20 EB Collector Distributor
Level – System / Network Potential Projects: • Managed Lane Conversion (HOV to HOT) • New Managed Lane System (HOT / TOL) • Adaptive traffic control systems • Corridor wide reversible lanes • Downtown grid network Understanding the impacts: • Change in mode choice • Significant change is traffic operations • Change in travel pattern • Multiple routes between each O-D pair • Controlling routes via DTA – A necessity Our Approach: • Tri-level / Two level modeling –> Macro-Meso, Macro-Micro • Tools: Visum - Vissim Cube - Cube Avenue -> Cube-Vissim
An Example – Need for DTA Path –> Function (Cost, Time, Distance)
Facility and Mode Type MI MC ME ME MI MC ME MC MI MC MI ME
Performance Measures Critical Step: Develop project needs – Performance measure matrix High Level or Detailed measures Performance measures – Deal Breaker Assess ability of simulation tools to capture the performance measures directly or indirectly
Advanced Traffic Management System Evaluation ME MI MI MI MI MI MI MI
Commercial Vehicle Operations Interstate Truck Weight Station
Special Studies • Evacuation Modeling • Planning for Special Events • Suitability of simulation models to large networks • High computational efficiency • Minimum details to produce reasonable estimates • Macro-Meso Model • Toll and Revenue Studies • Alternative comparison to estimate demand – I vs. 2 Managed Lane, Type of Managed Lane • Sensitivity testing to tolling • Macro level detail to screen alternatives • Planning for Work Zone • Need to capture effect of lost capacity • Extent of impact – Corridor or network level • Use of microscopic simulation to justify maintenance of traffic • 14th Street Bridge Project
Integrate with Other Applications • Does my project needs extend beyond traffic operational analysis? • Our experience with using modeling tools for other applications • ITS Concept Development – Planning Level • Traffic Safety Analysis
IDAS – An application • Estimate planning level reduction in crashes by accident type due to ITS • 3 out of 4 steps performed in IDAS to capture effect of ITS deployment on the system • Useful tool to develop planning level ITS concepts as part of major investment studies Output from macroscopic model fed to IDAS Estimate and compare the impact of non-recurring congestion between alternatives with and without ITS deployments
SSAM – An application • SSAM – Surrogate Safety Assessment Module • FHWA approved tool to perform safety analysis between alternatives • A post processor to microscopic simulation tool • Uses trajectory data from microscopic simulation tools (Vissim, Aimsun & Paramics) • Uses surrogate measures technique to estimate “conflicts” from the trajectory data • Reasonableness of conflict analysis closely tied to outputs from microscopic simulation • Sound methodology to estimate conflicts for alternatives that are yet to be built
SSAM – An Application Scenario -2 Scenario -1
Public Outreach Important step in most transportation projects Identify the level of detail to be presented to the public Convey information accurately, completely, and easy to comprehend Ability to develop 2D and 3D videos for ease of understanding Compatibility of simulation model with GIS 3D model development on major projects – revive 285 topend
Efficiency Cost-effectiveness Timeline Understand Client Needs Quality Matters
In Summary…. Imperative to understand three tier modeling approach Project based selection of simulation tools Uniqueness of each project No one “Tool” that can meet all project needs Model calibration to replicate real world scenarios Maximize the capability of simulation tools to integrate with other applications Maintain a balance between time, money, approach, innovation to strategically meet client needs Interpretation of the results from simulation tools defines successful application
Three Tier Modeling Snapshot Tier 1 Tier 2 Tier 3
Alternative Path Origin i Congestion Destination j Meso Meso Micro Future Trend in Integrated ModelingMeso-Micro LARGE URBAN OR METROPOLITAN AREA Mesoscopic Model SUBAREA2 (Problem Network) Detailed Microscopic Model Micro SUBAREA1 (Problem Network) Detailed Microscopic Model
Why hybrid simulation? • Micro models: • Good for small areas, with much detail, e.g. to study signal control in a number of intersections • Not so good for large areas. Difficult to calibrate, network coding takes a lot of effort and time, and simulations are slow. • Meso models: • Good For large areas, less detail, e.g. an entire city. Easier to calibrate, takes less time to code network, routing over entire network, fast simulations. • Not so good for detailed studies, such as adaptive signal control, merging areas etc.
Hybrid meso-micro simulation • Integrates meso- and micro models to: • Simulate a small area (or multiple small areas) in detail with micro simulation • Simulate surrounding area with meso simulation • Allows study of local effects of traffic operations, e.g. adaptive signal control with micro, and network effects with meso • Realistic inflows into micro from buffer network in meso, incorporating queue propagation over meso-micro boundaries. • Can capture redistribution effects of local changes, where traffic may avoid the micro area, or new traffic may be attracted to the micro area.
Common Module Travel behavior Database Network graph Pre-trip Travel times En-Route Paths Path generation OD flows Route choices Travel times Route choices Travel times Meso Model Micro Model Vehicles, Traffic conditions Hybrid framework
Conceptual Architecture Network data base Paths and path flows data base Static assignment MACRO Dynamic Assignment One shot or iterative MESO MICRO OD Matrices
Shortest Path algorithm Loop 1 Routes New Routes Travel Times Network New Travel times Mezzo Simulation Demand Loop 2 Assignment in Mezzo