Download
1 / 23
230 likes | 371 Vues
2018-19 Budget Presentation. 2018-19 General Fund Budget. State Aid Formula. Calculation of Instructional FTE Staff Factor (15:1 ratio) State Aid Fall Enrollment Count divided by 15: 4,170 / 15 = 278.00 FTE Need based on Instructional Staff Salary/Benefits

E N D
2018-19 General Fund Budget State Aid Formula Calculation of Instructional FTE Staff Factor (15:1 ratio) State Aid Fall Enrollment Count divided by 15: 4,170 / 15 = 278.00 FTE Need based on Instructional Staff Salary/Benefits Target Instructional Staff Salary $ 49,132 Target Instructional Staff Benefits (Salary x 29%) $ 14,248 TOTAL STAFF SALARY/BENEFITS $ 63,380 Multiply by FTE Staff Factor calculated above x 278.00 STAFF SALARY/BENEFITS NEED $17,619,703 Overhead Costs Calculation Staff Salary/Benefits Need $17,619,703 x 31.67%$5,580,160 Calculation of State Aid Staff Salary/Benefits Need $17,619,703 Overhead Costs Need 5,580,160 LEP Need 26,427 TOTAL NEED $23,226,290 Less, Local Effort (7,501,000) 2018-19 STATE AID SUBTOTAL $15,725,290 Plus, One-Time $$ (0.7%) 164,710 2018-19 STATE AID TOTAL $15,890,000
2018-19 General Fund Budget Instructional Budget $16,841,800 (61.7%) Support Services Budget $9,671,700 (35.4%) Activities $786,500 (2.9%)
2018-19 General Fund Expenditures Salary Increase – (2.5% Across the Board) plus Additional One-Time $$ $ 610,000 Benefits 137,000 Utilities 27,000 Additional Staff (Net) 460,000 Decrease in Grants (140,000) Retirement Staff Savings (55,000) Purchased Services , Supplies, Materials 60,000 TOTAL INCREASE $1,099,000
Number of Certified Employees (FTEs) # of F.T.E.’s ADM 1991-92 126.3 2140 1992-93 128.7 2149 1993-94 133.3 2186 1994-95 141.8 2208 1995-96 141.8 2215 1996-97 145.7 2265 1997-98 149.7 2310 1998-99 153.2 2406 1999-00 161.7 2487 2000-01 162.2 2510 2001-02 165.2 2532 2002-03 166.8 2584 2003-04 173.0 2649 2004-05 179.5 2722 2005-06 184.0 2795 2006-07 191.1 2920 2007-08 200.5 3031 2008-09 205.0 3095 2009-10 216.5 3227 2010-11 223.0 3335 2011-12 222.0 3373 2012-13 231.0 3488 2013-14 242.0 3585 2014-15 253.0 3640 2015-16 260.0 3778 2016-17 266.0 3932 2017-18 270.0 4057 2018-19 277.0 4170
Per Pupil Allocations Dollars % Increase
Educational Funds Per Pupil Cost (“Large Schools”)2016-17 State Statistical Profile
General Fund Balance History General Fund Balances 1989-2019 Fund Balance % of Expenditures 1989-2019
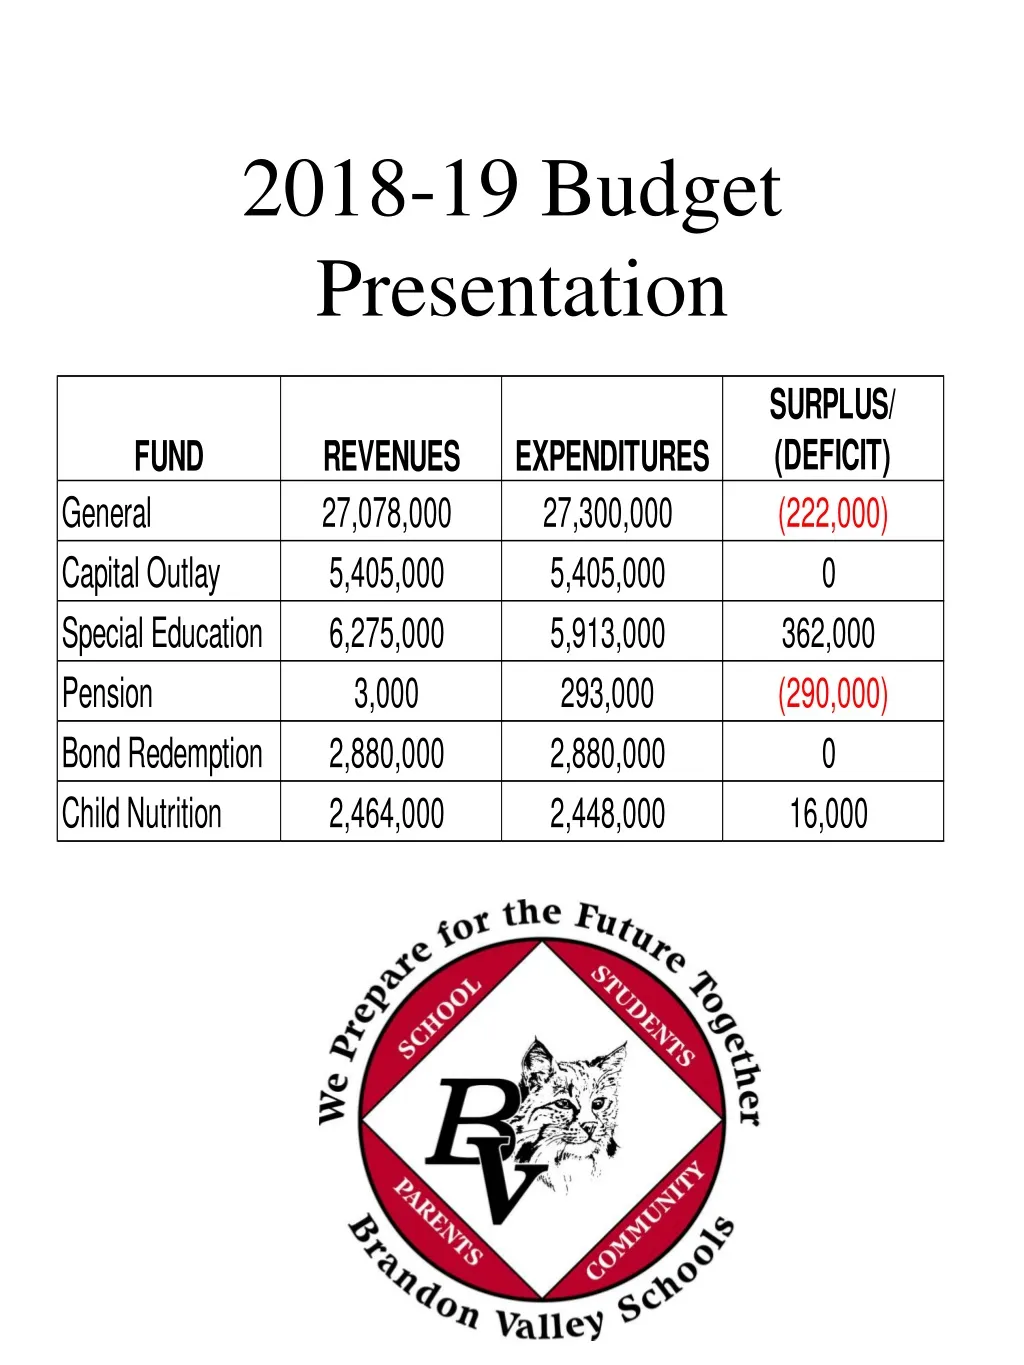
2018-19 General Fund Revenue$27,078,000 Where the Money Comes From • Local Taxes $ 8,320,000 • Local Sources $ 585,000 • County Apportionment $ 160,000 • State Sources $ 16,755,000 • Federal Sources $ 583,000 • Operating Transfers In $ 675,000
“Other Revenues” History GROSS RECEIPTS BANK FRANCHISE TAX COUNTY APPORTIONMENT
Operating Transfer to General Fund (12.5%) $675,000 Classroom Furnishings/ Equipment (3.3%) $180,800 2018-19 Capital Outlay - $5,405,000 Co-Curricular (0.6%) $32,000 Technology (20.6%) $1,113,400 Facility Improvements (40.3%) $2,178,500 Maintenance Equipment (0.9%) $47,000 Transportation (5.9%) $320,000 Band/Orchestra/Vocal (0.8%) $45,300 Debt Payment (10.3%) $555,000 Printing Services (1.5%) $80,000 Library/Texts (3.3%) $178,000
2018-19 Special Education Budget Instructional $ 4,365,600 Director 184,400 Transportation 283,000 Educational Co-op 635,000 Out of District Placements 445,000 $ 5,913,000 2017-18 Budget 5,670,000 Increase $ 243,000 (4.29%)
2018-19 Special Education REVENUE Local Sources $ 2,900,000 State Sources 2,610,000 Federal Sources 765,000 TOTAL $ 6,275,000
Pension Fund • Taxing authority was eliminated by 2016 SD Legislature • Fund will be used to pay early retirement costs for approximately (1) more year utilizing accumulated fund balance. • 2018-19 Budget proposes expenditures of $293,000
Brandon Valley Child Nutrition • Averages nearly 2,895 lunches/411 breakfasts served daily - Approximately 505,000 lunches/80,000 breakfasts per school year • An additional 124,530 “lunch equivalents” are served through ala carte sales • Budgeted revenues are $2,464,000 (+1.5%) • Budgeted expenditures are $2,448,000 (+1.9%) • Budget assumes the following meal prices: Lunch Breakfast K-6 $2.70 $1.75 7-8 $2.95 $1.90 9-12 $3.00 $1.95 Adult $3.55 $2.25 (No Increase)
District Valuation 1999-00 $498,301,691 2000-01 $563,144,801 2001-02 $627,309,734 2002-03 $667,851,518 2003-04 $727,553,636 2004-05 $790,047,800 2005-06 $880,306,176 2006-07 $977,303,441 2007-08 $1,061,601,396 2008-09 $1,137,347,460 2009-10 $1,186,131,080 2010-11 $1,218,887,102 2011-12 $1,224,128,258 2012-13 $1,255,569,594 2013-14 $1,311,480,167 2014-15 $1,423,036,061 2015-16 $1,544,277,400 2016-17 $1,681,907,405 2017-18 $1,781,416,029 2018-19 $1,977,253,080