Download
1 / 30
300 likes | 438 Vues
Energy Policy is putting both Electric Reliability and the Economy at Risk. Frank Clemente Ph.D. Senior Professor of Social Science & Energy Policy Penn State University fac226@psu.edu. 1. Reliable Electricity and the Economic Growth:.

E N D
Energy Policy is putting both Electric Reliability and the Economy at Risk Frank Clemente Ph.D. Senior Professor of Social Science & Energy Policy Penn State University fac226@psu.edu 1
Reliable Electricity and the Economic Growth: “Electricity use and gross national product [are] strongly correlated. The relationship … is so important that it should be considered in developing … energy and economic policies … to promote electrotechnologies … to lower the real cost of electricity ” National Academy of Science, 1986
Four Basic Premises • Reliable electricity at an affordable cost is the lifeblood of modern society • The U.S. has the most reliable system in the world and moderate prices have been our advantage • Both reliability and affordability are threatened as: (a) generation capacity erodes and (b) imported LNG looms as the default fuel • For the first time in history, the adequacy of our electric supply system will depend on decisions made in foreign countries
Reliability is Being Compromised Along Two Dimensions • Inadequate Generation Capacity • Planned baseload coal plants are being cancelled • Options to replace the scale of cancelled generation are: (a) limited, (b) expensive and, (c) vague • Emergence of LNG as the Default Fuel • NG comprises 90% of all new generation from 2000-2010 • North American NG production has peaked so LNG will play an even larger role • Global competition for LNG is intense, supply is limited so costs far exceed anything predicted by EIA
The Steady Erosion of Electric Reliability in the United States By 2016, only one in four states will be in a reliability region meeting NERC’s minimum acceptable standards Number of contiquous states in reliability regions where available capacity margin meets minimal accepted level reliability -- 15%
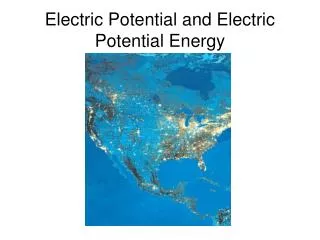
The Power of Ecowatts--More Electricity Means Less CO2 per GNP
The Rising Tide of Electricity Demand in the U.S. 7 Source: EIA, 2008
More Wells and Higher Prices Have Not Increased NG Production 9
OUR EMERGING DILEMMA IN NATURAL GAS “North American gas production is inadequate to meet demand. We are in competition with other importing regions for LNG supplies. And we are not predestined to prevail in that competition” –Joseph Kelliher, Chair of FERC, 2007 10
The Danger of Relying on NG for Electricity NG has 4 times the price and 20 times the price volatility of coal Using NG for electricity drives up the price of both electricity and NG for families and businesses. North American NG production has peaked. Thus, LNG imports from risky sources (e.g. Russia, Iran) must balance future supply—at high cost. 11
Using More NG to Produce Electric PowerIncreases the Price of Both NG and Electricity From 1993-2007, the amount of NG for electricity increased 92% Source-EIA, 2008
The U.S. Bets On A Brave New World Where new supply is projected to come from 2006-2019 Where new NG supply came from 1993 - 2006 “Importing LNG from abroad opens the U.S. fuel supply to the global market and all the economic and political risks associated with it” –NERC, 2007 14 14 • Source: EIA, 2008
Risky Dependence: Emerging Competition for LNG 15 15
Reality Sets In: The Steady Decline in EIA Forecasts of U.S. Imports of LNG in 2008 2008 (June) Year Forecast Made For 2008 Imports 16
The Long Run Price of NG/LNG in a Peak Oil World Source: Adapted from "The Relationship Between Crude Oil and Natural Gas Prices," Hartley et. al, Rice University, 2007 17
EIA Under Forecasted 2007 Consumption of NG for Generation for 11 Straight years-including 2007 Actual 2007 Consumption for Generation EIA’s forecasts for 2007 were off the mark every time in the same direction. Clear evidence of systematic bias.
WHERE WILL THE ELECTRICITY COME FROM? “Disruptions in the supply of natural gas could have a significant impact on the availability of electricity” –NERC, 2007 19
Coal Is the Cornerstone Of Electricity Generation In The U.S. 20 20
Coal has Buffered Millions of Consumers from Even Higher Electricity Prices 21
When California’s Daily Peak exceeded 45,000 MW, in no case did wind provide more than 325 MW despite rated capacity of 2500 MW. Wind Generation’s Performance During 2006 California Heat Wave * Adapted and estimated from Dixon, U.S. DOE (2006) 22 22
Nuclear Power: Four bottlenecks will significantly delay the construction of new nuclear power plants in the United States High Level Waste management, transportation and storage Entrenched Opposition at both national and local levels Supply chain issues (a) availability and cost of fuel, (b) expertise (c) global competition for nuclear grade components 4. Societal inertia, litigation and bureaucratic creep –we have not built a nuclear plant for decades.
Bottleneck: Competition with the rest of the world for nuclear grade components, fuel and expertise –we are behind the curve and falling New Reactors which will come online by 2015 Source: World Nuclear Association
Lest We Forget : US Coal Reserves vs. Oil and NG Reserves Source: EIA, 2008 25 25
This Second “NG Dash to Gas” is Real, Risky and Expensive Source, Platts, 2007 *Note: The Platts survey is the most recent available but does not include many recently proposed NG Plants or many recently cancelled coal plants 26
EIA has Under Forecast the Price of NG to Produce Electricity for 12 straight years, including 2008 itself Actual 2008 Price of NG for Generation $9.50
We were Warned of the Consequences of the first “Dash to Gas”---Construction of Over 220 GW of NG From 2000-2006 • 1997: “if Lower-48 proved gas reserves are reported to EIA with reasonable accuracy, and inferred reserves as assessed by the Department of the Interior prove generally reliable…by early in the next century, natural gas will have become more of an energy problem than an energy solution” –Joseph Riva, Colorado School of Mines • 2008: “Construction of natural gas fired power generation in the last decade has placed an unreasonable strain upon the U.S. natural gas system. Natural gas must be used to meet new electricity load growth…this unfettered demand growth appears to have come at the expense of other consumptive sectors” -Credit Suisse Bank
The Specter of Higher Electric Rates:A Few Examples • Pennsylvania: “estimated 8 to 63 percent increases loom on the horizon” (AP, 6/08) • Texas: “electricity-price spikes…consumers could face second prices this summer” (WSJ, 6/08) • New Jersey: “residents will see double-digit increases in electric bills this summer” (AP,2/08) • Florida: FPL requestsDramatic increases in the cost of fuel, the price of natural gas, which fuels 50 percent of FPL's electricity generation, has risen from $8.17 per million BTU to $10.75 per million BTU, a 32 percent increase.
States Which Will Fall Below Minimum Capacity Levels by 2016