Download
1 / 29
290 likes | 291 Vues
This study investigates decadal climate variability (DCV) during the last millennium using high-resolution proxies. It examines the role of solar and volcanic forcing, as well as internal climate modes, in explaining DCV. The study also explores the potential contribution of stochastic models to understanding multi-year climate variability.

E N D
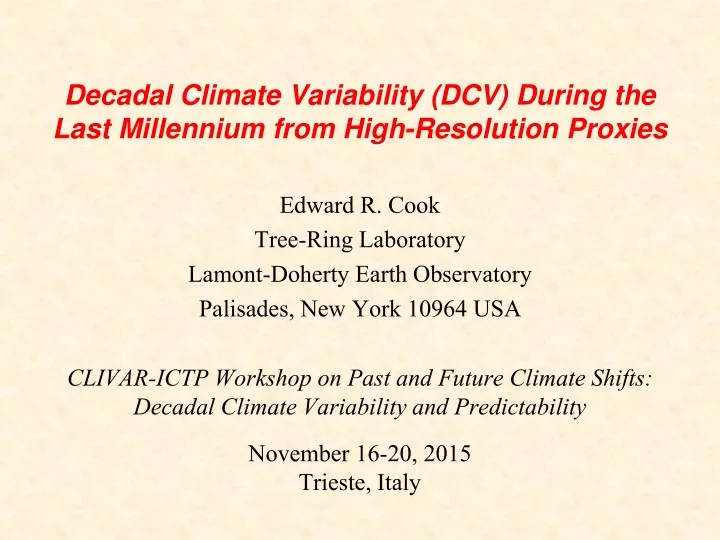
Decadal Climate Variability (DCV) During theLast Millennium from High-Resolution Proxies Edward R. Cook Tree-Ring Laboratory Lamont-Doherty Earth Observatory Palisades, New York 10964 USA CLIVAR-ICTP Workshop on Past and Future Climate Shifts: Decadal Climate Variability and Predictability November 16-20, 2015 Trieste, Italy
20th Century temperature change is increasingly dominated by GHG forcing since ~1970 - both globally and regionally. http://ipcc-wg1.ucar.edu/wg1/wg1-figures.html
However, a lot of decadal (to centennial) variability (DCV) in paleoclimate data may not be accounted for by the models A lot of DCV, but also a lot of uncertainty! http://ipcc-wg1.ucar.edu/wg1/wg1-figures.html
Over the past millennium, solar and volcanic forcing may explain some of this “natural” variability. http://ipcc-wg1.ucar.edu/wg1/wg1-figures.html
Synthetic “red noise” process from normally distributed white noise: xt= 0.999xt-1 + et (Wunsch, 1999). DCV by chance alone is readily apparent. But the simplest explanation for most DCV takesan “Occam’s Razor” approach • A low-order stochastic (e.g., a simple Hasselman-style red noise or low-order ARMA model) appears to be sufficient to explain multi-year variability apparent in (typically) short instrumental climate records. • Wunsch (1999) argued that multi-year variability in instrumental records could be simply be modeled and simulated by low-order ARMA models (Wunsch, 1999, “The interpretation of short climate records, with comments on the North Atlantic and Southern Oscillations”, BAMS). • This realization led to the null hypothesis that simple stochastic (e.g., low-order ARMA models are sufficient to describe, if not explain, multi-year climate variability. • So what are the alternate hypotheses?
Mitchell, J.M. 1976. An overview of Climatic Variability and its causal mechanisms. Quaternary Research 6:481-493. Solar variability at multiple time scales (punctuated by explosive volcanism, lunar tidal forcing too) had long been thought to contribute to DCV. DCV No Internal Climate Modes Some proposed time scales of solar forcing: • ~11-yr “Schwabe” Cycle • ~22-yr “Hale” Cycle • ~87-yr “Gleissberg” Cycle • ~210-yr “De Vries” Cycle All are really “quasi-periodic” at best
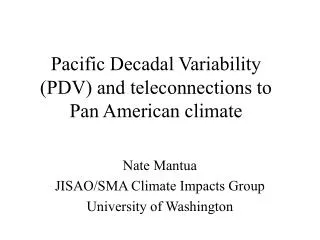
Age of Earth Annual solar forcing Evolution of Earth, Atmosphere, and Biosphere DCV Variance Increasing -> Tectonic Cycles: Mountain Building and Weathering Diurnal Cycle No solar or volcanic forcing now Orbital (Milankovitch) Cycles Dansgaard- Oeschger Cycles Annual Harmonics QBO AMO Synoptic Weather ENSO PDO NAO Diurnal Harmonics AMO 109 108 107 106 105 104 1,000 100 10 1 0.1 0.01 0.001 Time (Years) After: http://www.ncdc.noaa.gov/paleo/ctl/about1.html More recently, internal climate modes have been recognized as probably the most important contributors to DCV • El Niño/Southern Oscillation (ENSO) -- 2-7 yrs (+ LF modes) • North Atlantic Oscillation (NAO) -- 7-8 yrs (+ LF modes) • Pacific Decadal Oscillation (PDO) -- 20-40 yrs • Atlantic Multidecadal Oscillation (AMO) -- 60-80 yrs • NAM, SAM, and the modes goes on . . .
Global-scale oscillatory modes of temperature variability (1891-1990) have also been identified using MTM-SVD spatiotemporal analysis Mann, M.E. and J. Park. 1994. Global-scale modes of surface temperature variability on interannual to century timescales. JGR 99:25,819-25,833. Mann, M.E. and J. Park. 1999. Oscillatory spatiotemporal signal detection in climate studies: a multiple-taper spectral domain approach. Advances in Geophysics 41.
Trend AMO? PDO? Solar? ENSO ENSO Band-limited global-scale modes of temperature variability (Mann & Park, 1994)
Some comments now • There appears to be little doubt that some form of band-limitedDCV existsin instrumental climate records. The sources of this oscillatory variability are not always clear. ENSO, NAO, PDO, AMO, etc. forcing is highly likely, maybe even SOLAR too, punctuated by volcanic forcing • The question now is “Is this apparent oscillatory variability just a short-term expression of stochastic (e.g., red noise or low-order ARMA) variability that arose mostly by chance in the mostly 20th century instrumental observations?”(the previous null hypothesis) • Or “Is this apparent oscillatory variability indicative of long-term band-limited forcing of the coupled climate system?”(a generic alternate hypothesis) • At DCV time scales, like those associated with the PDO and AMO, it is extremely difficult to tell which hypothesis is more likely to be correct given the relatively short instrumental records . . . and theory is that not much help either. • This puts us in an uncomfortable situation described by Wright (1971) as “Two Rules of Climate Change.”
Two Rules of Climate Change Wright, P.B. 1971. Quasi-biennial oscillations in the atmosphere. Weather 26:69-76. • “Some feature of the atmosphere can always be found that will oscillate in accordance with your hypothesis.” • “Shortly after its discovery the oscillation will disappear.”
To investigate the longer-term existence ofoscillatory DCV climate modes • We need longer records of the climate modes thought to be responsible for Dec-Cen climate variability. • Annually resolved, exactly dated, tree-ring reconstructions of climate modes (ENSO, PDO, NAO, AMO) can be used to determine if oscillatory variability seen in the instrumental climate records occurred in the past. • Null hypothesis: Band-limited variability exists in the observations by chance alone due to internal stochastic forcing in the coupled climate system and should not be expected to have persisted over time. The disappearance of observed oscillatory behavior in the long climate mode reconstructions would support this null hypothesis. • Alternate hypothesis: Observed band-limited variability persists back in time in the reconstructions in ways that suggest some form of intrinsic or extrinsic quasi-periodic forcing that is not easily explained by simple stochastic forcing. The presence of such oscillatory behavior in long climate mode reconstructions would support this alternate hypothesis.
Six climate mode reconstructions by tree rings will be examined for existence of long-term oscillatory behavior • Dec-Feb ENSO Niño 3.4 SST Reconstruction - A.D. 1300-2006 - Cook et al. 2008. ENSO reconstructions from long tree-ring chronologies: Unifying the differences? Contributed talk presented at a special workshop on “Reconciling ENSO Chronologies for the Past 500 Years”, held in Moorea, French Polynesia on April 2-3, 2008. • Annual PDOreconstruction - A.D. 993-1996 - MacDonald and Case. 2005. Variations in the Pacific Decadal Oscillation over the past millennium. Geophysical Research Letters 32, L08703, doi:10.1029/2005GL022478. • Apr-Aug PDOreconstruction - A.D. 1479-2001 - Cook. 2002. Reconstructions of Pacific decadal variability from long tree-ring records. Invited talk (GC42A-04) presented at Special Session GC 1600: “Pacific Decadal Variability”, Spring AGU, N. Mantua and E. Sarachik (conveners). • Dec-Mar NAO reconstruction - A.D. 1400-2008 - Cook et al. 2002. A well-verified, multiproxy reconstruction of the winter North Atlantic Oscillation index since A.D. 1400. Journal of Climate 15:1754-1764. • Annual AMO reconstruction - A.D. 1567-2008 - Gray et al. 2004. A tree-ring based reconstruction of the Atlantic Multidecadal Oscillation since 1567 A.D. Geophysical Research Letters 31, L12205, doi:10.1029/2004GL019932. • Jun-Aug NAM (AO) SLP reconstruction - A.D. 1650-2007 - D’Arrigo et al. 2003. Tree-ring reconstructions of temperature and sea-level pressure variability associated with the warm-season Arctic Oscillation since AD 1650. Geophysical Research Letters 30, 1549,doi:10.1029/2003GL017250. This list is illustrative, not comprehensive.
Methods of analysis • Spectral analyses of the actual and reconstructed climate modes will be conducted using multi-taper (MTM) and wavelet methods to describe the band-limited properties of the data. • Significance tests of spectral peaks will be based on a priori probabilities and a red noise null continuum model (see Gilman et al. 1963. “On the power spectrum of red noise”, JAS 20; Mann & Lees. 1996. “Robust estimation of background noise and signal detection in climate time series”, Climatic Change 33). • The superior leakage resistance and consistency of MTM over other methods of spectral analysis will provide robust tests of the overall presence of band-limited variability. • The wavelet spectrum (Torrence and Campo. 1998. “A practical guide to wavelet analysis”, BAMS 79) will reveal the degree to which the band-limited variability in the actual data is present back in time in the reconstructions.
Weakly Inter-decadal Inter- to multi-decadal
Multi-decadal Multi-decadal to centennial
Multi-decadal Multi-decadal to centennial
Multi-decadal Multi-decadal
Multi-decadal Multi-decadal to centennial
Multi-decadal Multi-decadal to centennial
Results from spectral analyses • All of the reconstructed climate modes have various degrees of band-limited DCV that intermittently persist over time. • This variability commonly falls in the general 30-100 year band. • The December-March NAO reconstruction has the weakest expression of long-term band-limited multi-decadal variability. • The PDO, AMO, and NAM reconstructions all show the long-term presence of band-limited multi-decadal variability, but much of it resides in the “cone of influence”of the wavelet spectrum. • None of the climate mode reconstructions are really long enough to describe band-limited centennial time scale variability in a statistically robust way. • For that I will use a 1,481 year long April-August temperature reconstruction from northern Sweden where climate should be influenced by the AMO and NAM. • This is followed by a 1,276 year long January-September temperature reconstruction for the Gulf of Alaska that may have a connection to the PDO.
Briffa et al. 1992. “Fennoscandian summers from AD 500: temperature changes on short and long timescales”, Climate Dynamics 7:111-119. Multi-decadal to centennial
Wilson et al. 2007. “Cycles and shifts: 1,300 years of multi-decadal temperature variability in the Gulf of Alaska”, Climate Dynamics 28:425-440. Inter-decadal Centennial
Some more comments now • From the spectral analyses of the climate mode reconstructions and two very long temperature reconstructions, intermittent band-limitedDCV appears to be a common feature over the past several centuries to millennium or more in the past. • It does not appear to be a transient phenomenon restricted just to the 20th century. Rather, its strength appears to come and go over time in an amplitude modulated way. • A preferred DCV band is difficult to define, but it often occurs in the 30-100 year band. PDO and AMO forcing? • Variability at centennial time scales is present in some of the reconstructions, but it is far less robustly identified due to the limited lengths of some reconstructions. • These results allow for internal stochastic forcing to be the cause of DCV. However, the band-limited nature of the variability does not easily admit a simple red noise process as an explanation. Rather, the power spectra suggest a mixture of low-order ARMA forcing (with complex roots?) and other band-limited forcing. • These results still permit the possibility that there could be an external rhythmic forcing of climate (e.g. by solar) that contributes to DCV.
Improving Our Understanding of Causes of DCV • The development of spatial climate reconstructions from tree rings provides a vehicle for better understanding the properties and causes of DCV – an example here from three independent drought atlases Science 2004 NADA Science 2010 MADA Science Advances 2015 OWDA
Improving Our Understanding of Causes of DCV Note the anti-phased behavior between drought atlases that persists over time. Suggests long-term ocean/atmosphere forcing 30yr low-pass Figure from Cook et al. 2015. Science Advances.
Here is an example from the drought atlases:The hemispheric pattern of continential hydroclimatic variability during the Puebloan Great Drought period implies large-scale oceanic forcing as the cause Dry Wet Dry Negative NAO La Niña La Niña Wet Figure courtesy of Kevin Anchukaitis See also Coats et al., 2015: Are simulated megadroughts in the North American southwest forced? Journal of Climate 28:124-142.
Expanding drought atlas coverage to thefull Pacific Ocean rim land areas: New Palmer et al., 2015 ERL. Proposed
With this said, • “I am finished!”(The last line in the movieThere Will Be Blood.)