Download
1 / 74
740 likes | 875 Vues
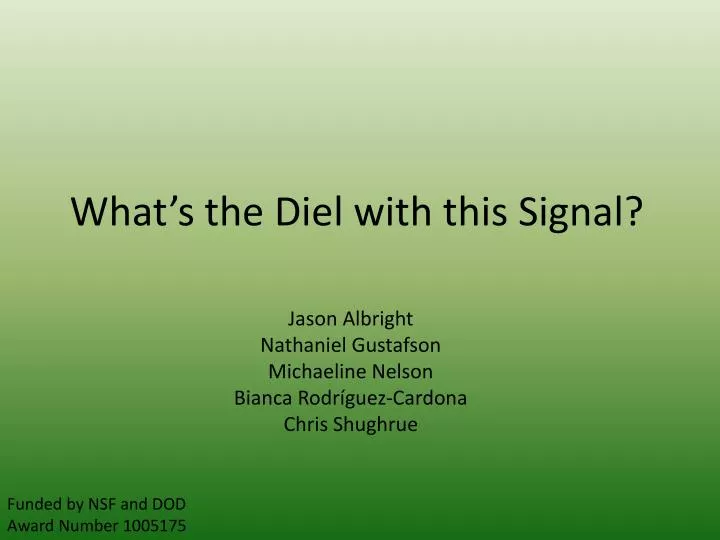
What’s the Diel with this Signal?. Jason Albright Nathaniel Gustafson Michaeline Nelson Bianca Rodríguez-Cardona Chris Shughrue. Funded by NSF and DOD Award Number 1005175. Diel Fluctuations in stream height. Water Height (m). 8. 9. 10. 11. 12. 13. Days in July, 2010.

E N D
What’s the Diel with this Signal? Jason Albright Nathaniel Gustafson Michaeline Nelson Bianca Rodríguez-Cardona Chris Shughrue Funded by NSF and DOD Award Number 1005175
Diel Fluctuations in stream height Water Height (m) 8 9 10 11 12 13 Days in July, 2010
Evapotranspiration Solar Radiation Air Temp VPD Q Soil Moisture Sap Flow
Volume from S.G. • Q = P – ET + ∆S
Significance • Use discharge to approximate ET • Interesting eco-informatics question because looks at watershed as a complete system
Eco-informatics conceptual model Observed Diel Empirical Model Analytical Model
Questions • What factors are principally responsible for creating diel signals? • How are ET induced signals affected by base-flow levels and watershed characteristics? • Are diel fluctuations synchronized across a watershed? • Does channel morphology influence diel fluctuations? • What are the mechanisms for the influence of ET on diel fluctuations?
Watershed 1 • 95.9ha area • Clear cut in the 60’s • Red Alder • Most steam reaches are alluvial deposits
Watershed 2 • 60.3ha area • Old Growth • Western Hemlock and Douglas Fir • Channel mostly bedrock
What factors are principally responsible for creating diel signals?
What we have to work with • Abundant data available through HJ Andrews • Lots of collaboration, local knowledge • Personally ‘familiar’ with 2-3 watersheds
Stream network length Air temp Dielstrength* slope Solar Radia’n soil type Data Snow-melt (mm/day) Evapo-Transpiration (mm/day) Effective Riparian area** WS Snow content WS ground-water content Process Temporal WS property Drainage parameters Measured Estimated Parameters *Diel Strength = amplitude of diel signal in cfs ** (Riparian) area contributing to diel signal, m2
Summertime ~.05cfs
What we’re seeing • Diel signal ≈ Solar Radiation • Conditional: WS has enough ground-water
Mack Creek WS1 http://farm4.static.flickr.com/3407/4617034064_e46e675a86.jpg
What we’re seeing • Diel signal ≈ Sol.Rad. via ET in summer • Conditional: WS has enough ground-water • Temperature -> Snowmelt signals in spring • IF snow is present and melting
What we’re seeing • Diel signal ≈ Sol.Rad. via ET in summer • Conditional: WS has enough ground-water • Temperature -> Snowmelt signals in spring • IF snow is present and melting • Watersheds may have neither, one, or both
Stream network length Air temp Dielstrength* slope Solar Radia’n soil type Data Snow-melt (mm/day) Evapo-Transpiration (mm/day) Effective Riparian area** WS Snow content WS ground-water content Process Temporal WS property Drainage parameters Measured Estimated Parameters *Diel Strength = amplitude of diel signal in cfs ** (Riparian) area contributing to diel signal, m2
How are ET induced signals affected by base-flow levels and watershed characteristics?
Watershed 10: 2009 Watershed 9: 2009
How are ET induced signals affected by base-flow levels and watershed characteristics? • WS1, WS9, and WS10 show signals that correlate with air temperature, while WS2, WS3, WS6, WS7 and WS8 signals don’t correlate • WS1 phase shifts are correlated to precipitation and height of base flow. • WS1 time lags behave different from WS9 and WS10.
10 8 9 11 12 13 Days in July, 2010 Data provided by Tom Voltz
Are diel fluctuations synchronized across a watershed? Yes: staff gage, capacitance rod, wells and stream in phase
Bedrock channel staff gage (July 14-15, 2010) Bedrock channel staff gage (July 7-8, 2010) 0.2- 0.3 cm Change in Stage Height=
Alluvial channel staff gage (July 14-15, 2010) Alluvial channel staff gage (July 7-8, 2010) 0.6 - 3.5 cm Change in Stage Height=
Does channel morphology influence diel fluctuations? Yes: signal in alluvial reaches is stronger than bedrock reaches
What are the mechanisms for the influence of ET on diel fluctuations?

![[VII]. Regulation of Gene Expression Via Signal Transduction](https://cdn2.slideserve.com/4429639/slide1-dt.jpg)