Download
1 / 26
260 likes | 399 Vues
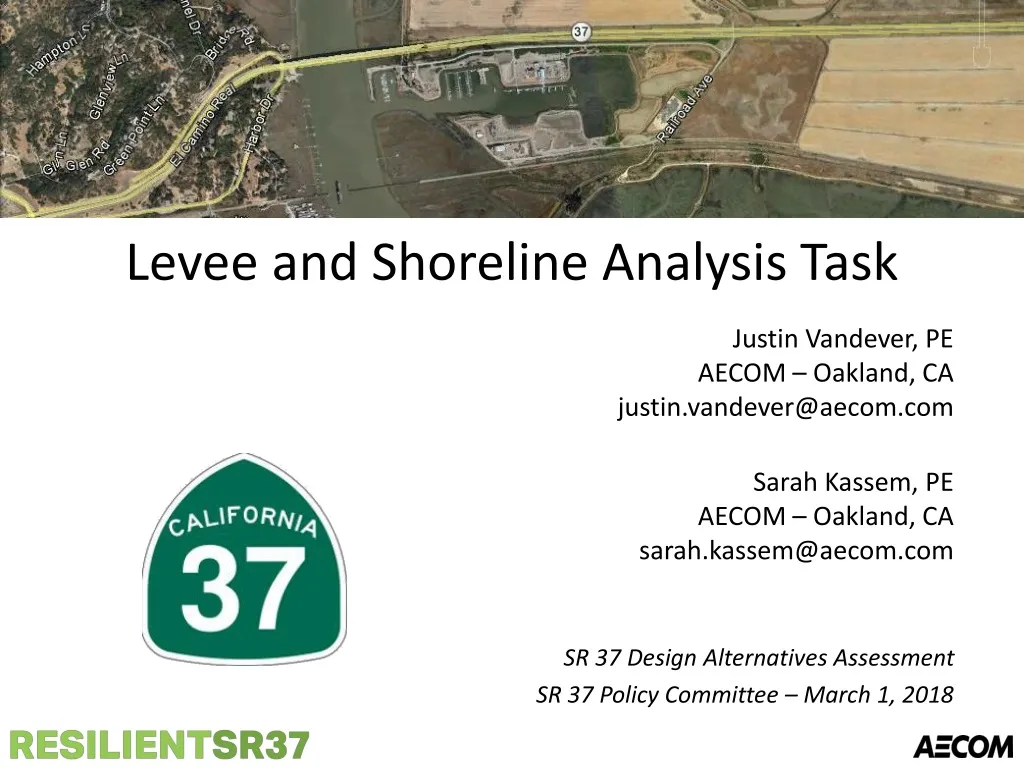
Levee and Shoreline Analysis Task. Justin Vandever, PE AECOM – Oakland, CA justin.vandever@aecom.com Sarah Kassem, PE AECOM – Oakland, CA sarah.kassem@aecom.com SR 37 Design Alternatives Assessment SR 37 Policy Committee – March 1, 2018. Introduction & Approach.

E N D
Levee and Shoreline Analysis Task Justin Vandever, PEAECOM – Oakland, CAjustin.vandever@aecom.com Sarah Kassem, PE AECOM – Oakland, CAsarah.kassem@aecom.com SR 37 Design Alternatives Assessment SR 37 Policy Committee – March 1, 2018
Introduction & Approach • Shoreline Analysis Task Goal • Identify potential strategies to mitigate near-term flood risks to SR 37 prior to implementation of the corridor-wide project • Educate stakeholders about near-term flood vulnerabilities along the SR 37 corridor and potential mitigation actions • Approach • Identify locations of potential shoreline overtopping for various SLR/storm scenarios • Identify potential for other shoreline deficiencies (erosion, instabilities, seepage) • Develop toolbox of conceptual design strategies • Evaluate applicability of each strategy to different shoreline types • Develop cost estimate to meet different levels of near-term flood protection
What is included in this evaluation? High level evaluation of levee and shoreline elevations relative to Bay flood levels Identification of potential flood mitigation strategies to address near-term flood vulnerabilities Estimation of magnitude and extent of necessary levee and shoreline crest elevation improvements Rough order of magnitude cost estimate to address levee and shoreline elevation deficiencies along SR 37 corridor
What is NOT included in this evaluation? Geotechnical evaluation of levee and shoreline condition and stability Estimation of costs to address potential geotechnical issues Site-specific engineering design or a specific project recommendation Estimation of environmental mitigation or land acquisition costs Assessment of combined riverine-coastal flooding
Levees protect low-lying portions of SR 37 • Completed review of levee ownership • Private • Public • Approximately 20 different land owners/managers • No single coordinating entity • Levees protect existing land uses • Agricultural • Biosolids/soil amendment • Shallow pond habitat • Road and railway • Other
Critical Shoreline • Shoreline segments that provides direct flood protection to SR 37 • A1: Novato Creek levees • A2: Petaluma River levees & Port Sonoma shoreline • B1: Tolay Creek/Tubbs Island levees • B2: SR 37 from Sonoma Creek to Napa River (incl. Mare Island) • C: SR 37 from Novato Creek to I-80 A1 B1 A2 B2 C
Potential Shoreline Deficiencies *Not evaluated in detail in this assessment and not included in cost estimate • Freeboard – Is the shoreline, levee, or roadway high enough to prevent overtopping by floodwaters? [focus of this evaluation] • Erosion*– Have waves or high flows eroded the shoreline or levee? • Seepage*– Is the shoreline or levee an effective barrier to flow through or underneath? • Stability*– Is the shoreline or levee stable from a geotechnical standpoint?
Levee Deficiencies Freeboard Erosion
Levee Deficiencies Seepage Stability
Overtopping Deficiencies • Evaluate length of shoreline exposed to overtopping • Multiple storm and SLR scenarios for present day and 2050 • Differentiated between roadway and levee segments Roadway Levee
Overtopping Deficiencies for A1 Present Day 10-yr Storm/2050 1-yr Storm • 2% of shoreline is deficient • 45% of shoreline is deficient during 100-yr storm in 2050
Overtopping Deficiencies for A2 Present Day 10-yr Storm/2050 1-yr Storm • 11 miles of levee protect 4 miles of highway • 11% of shoreline is deficient • 80% of shoreline is deficient during 100-yr storm in 2050
Overtopping Deficiencies for B1 Present Day 10-yr Storm/2050 1-yr Storm • 11 miles of levee protect 2 miles of highway • 6% of shoreline is deficient • 80% of shoreline is deficient during 100-yr storm in 2050 • Tolay Lagoon: • 2800 ft flood wall along roadway • 3500 ft levee improvement along adjacent levee segments
Overtopping Deficiencies for B2&C Present Day 10-yr Storm/2050 1-yr Storm • 5% of shoreline is deficient • 40% of shoreline is deficient during 100-yr storm in 2050 • Mare Island: • 1600 ft flood wall along south side of roadway • Flood waters come from south side
Minor Shoreline Deficiencies • Lack of patrol road • Insufficient geometry • Excess vegetation • Animal burrows
Field Visit Observations Erosion Excess Vegetation Seepage Stability
Levee Improvements Overtopping – raise crest Stability and seepage – add stability berm Erosion – add rock slope protection
Shoreline Improvements Concrete wall Exposed Sheet pile wall Sheltered • Applicable to roadway shoreline: • Mare Island • Tolay Creek • Not applicable to roadway in A1 & A2 because road surface too low • Erosion protection in areas exposed to waves • Potential drainage improvements
Raise Roadway • Need to tie into existing roadway elevation • Only appropriate where overtopping deficiencies are small • May not be feasible due to traffic impacts Applicable to Mare Island and Tolay Lagoon low spots
Estimating Costs Estimated average dimensions for existing levee and roadway Assumed an average raised height of 2 ft for all strategies • Costs include: • Direct unit costs • Indirect unit costs (15%) • Overhead and profit (21%) • Construction contingency (25%) • Design fee and contingency (25%) • Environmental clearance (10%) • Not included: • Environmental mitigation • Land acquisition costs LF = linear feet (cost per foot of improvement) Costs developed for overtopping strategies only (not seepage, erosion, stability, etc.)
Shoreline Protection Cost Estimate For 2050 flood protection (12’’ of SLR) Ranges in cost due to alternative options Costs to mitigate overtopping deficiencies only
Shoreline Protection Cost Estimate Ranges in cost due to alternative options Costs to mitigate overtopping deficiencies only
Cost Estimate Assumptions Does not include environmental mitigation or land acquisition costs Does not address potential levee erosion, seepage, or stability issues, which could increase costs above estimates Represents a minimum level of investment needed to provide flood protection Evaluated strategies would likely provide up to 10-year flood protection with 1 ft of SLR
Substantial investment required to maintain adequate level of flood protection Evaluation considered concept level strategies to address weak links in levee and shoreline elevations Further geotechnical evaluation would likely identify need for additional levee improvements beyond those identified in this study Small-scale fixes can only address near-term flood vulnerabilities for small amounts of SLR (up to 12”) Long-term corridor-wide solution needed to address higher amounts of SLR