Download
1 / 42
420 likes | 561 Vues
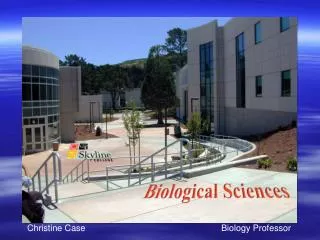
Christine Case. Methods. Looked at Instructional Objectives in course outlines. Results. SLOs for all courses SLOs for all programs. Results. SLOs for all courses SLOs for all programs www.smccd.edu/ accounts/ skybio. Programs. General Education (100s) Majors (215, 230)

E N D
Methods • Looked at Instructional Objectives in course outlines
Results • SLOs for all courses • SLOs for all programs
Results • SLOs for all courses • SLOs for all programs • www.smccd.edu/accounts/skybio
Programs • General Education (100s) • Majors (215, 230) • Allied Health Sciences (240, 250, 260) • Biotechnology (400s) • Honors (675)
BIOL 101 Students • 4 semester units • 3 lecture hr/wk • 3 lab hr/wk
BIOL 101 Students • 72% plan to transfer • 22% BUS majors • 20% undecided • 37 college units • Range: 0-120
BIOL 101 • Mission: To provide students with the knowledge, experiences, & skills needed to make decisions regarding personal and environmental health.
Definitions • Evaluation • to make a conclusion about student learning • Assessment • is ongoing. • To continually evaluate student learning against outcomes to improve programs. • To reflect on what we do for our students and what we should do.
SLOAC Methods • Direct: • Require students to demonstrate their knowledge, skills and/or abilities. • Indirect: • Students reflect on their learning rather than demonstrate it.
Criteria • Are all students expected to achieve a certain proficiency level for an outcome? • Would the program be satisfied if only a certain percentage of students achieve a certain level of proficiency? • What should this percentage and level be? • Consider the “criterion point” at which the program would want to initiate curriculum changes. M. Zieky and M. Perie. A Primer on Setting Cut Scores on Tests of Educational Achievement. Educational Testing Service, 2006. http://www.ets.org
The criteria are • “…subjective; it is important notto assume that criteria values accurately reflect student performance.” C. Horn et al. Cut Scores: Results May Vary. NBETPP Monographs 1(1). eScholarship@BC, 2000.
Direct Outcome Results
Direct Outcome Results
Indirect Outcome Results
Indirect Outcome Results
For example: • I enjoy studying Biology. • Strongly agree Agree Disagree Strongly disagree • Semantic differential • Biology is: Clean | | | | Dirty • Citizenship • I plan to vote in the upcoming election. C. L. Case. American Biology Teacher 42(2):121-123, 1980. J. E. Roueche et al. Assessing Student Opinions of the Learning Experience. Machaca TX: Sterling Swift, 1976.
Outcome Results When I hear Biology, I have a feeling of dislike
Year Over Year When I hear Biology, I have a feeling of dislike
Outcome Results Not frightened by performing an experiment in lab
Outcome Results Not frightened by performing an experiment in lab
Year Over Year Not frightened by performing an experiment in lab
Year Over Year Not frightened by performing an experiment in lab
Citizenship • Nonvoters: • 56% not citizens • 26% not registered