Download
1 / 11
110 likes | 307 Vues
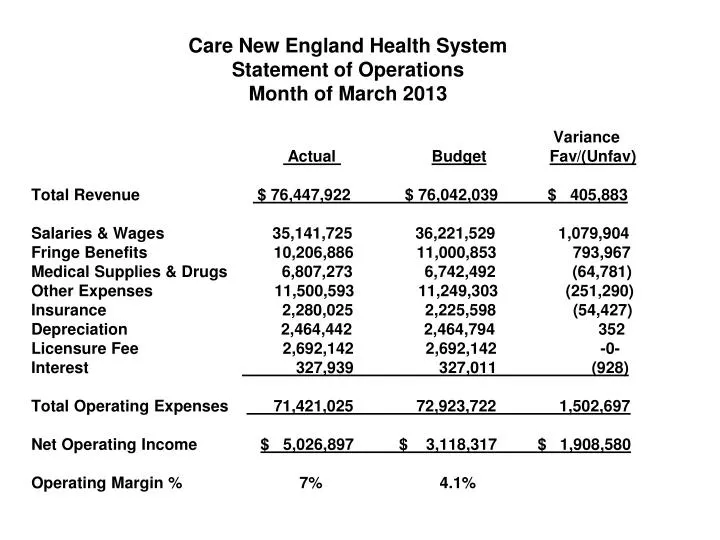
Care New England Health System Statement of Operations Month of March 2013. Variance Actual Budget Fav/(Unfav) Total Revenue $ 76,447,922 $ 76,042,039 $ 405,883

E N D
Care New England Health SystemStatement of OperationsMonth of March 2013 Variance Actual BudgetFav/(Unfav) Total Revenue $ 76,447,922 $ 76,042,039 $ 405,883 Salaries & Wages 35,141,725 36,221,529 1,079,904 Fringe Benefits 10,206,886 11,000,853 793,967 Medical Supplies & Drugs 6,807,273 6,742,492 (64,781) Other Expenses 11,500,593 11,249,303 (251,290) Insurance 2,280,025 2,225,598 (54,427) Depreciation 2,464,442 2,464,794 352 Licensure Fee 2,692,142 2,692,142 -0- Interest 327,939 327,011 (928) Total Operating Expenses 71,421,025 72,923,722 1,502,697 Net Operating Income $ 5,026,897 $ 3,118,317 $ 1,908,580 Operating Margin % 7% 4.1%
Care New England Health SystemStatement of OperationsYear-To-Date Fiscal Year 2013 Variance Actual Budget Fav/(Unfav) YTDYTDYTD Total Revenue $ 427,630,267 $ 430,586,776 $ (2,956,509) Salaries & Wages 211,050,272 216,232,906 5,182,634 Fringe Benefits 63,279,940 65,405,470 2,125,530 Medical Supplies & Drugs 39,044,675 38,119,598 (925,077) Other Expenses 67,546,977 66,420,735 (1,126,242) Insurance 13,288,367 13,349,215 60,848 Depreciation 14,767,990 14,788,760 20,770 Licensure Fee 16,152,855 16,152,855 -0- Interest 1,748,990 1,873,135 124,145 Total Operating Expenses 426,880,066 432,342,674 5,462,608 Net Operating Income $ 750,201 $ (1,755,898) $ 2,506,099 Operating Margin % 0.2% (0.4%)
Women & Infants CorporationControllable ExpensesFor the Month of March 2013 Variance ActualBudgetFav/(Unfav) Total Net Revenue $ 41,745,784$ 38,722,732$ 3,023,052 Salaries 15,937,032 16,576,522 639,490 Medical Supplies 1,897,330 1,783,279 (114,051) Drugs 1,218,536 1,221,150 2,614 Other Expenses: Consulting 133,475 165,422 31,947 Non-Medical Supplies 122,202 117,683 (4,519) Purchased Services 1,604,067 1,659,363 55,296 Maintenance Contracts 133,183 138,128 4,945 Repairs & Maintenance 186,907 191,812 4,905 Food Costs 80,680 82,695 2,015 Rent Equipment 80,148 79,473 (675) Dues & Subscriptions 60,120 99,743 39,623 Travel & Education 110,665 122,520 11,855
Fiscal Year 2013 MetricsMonth of March 2013 CNE (excludes VNA)Women & Infants March March Variance March March Variance ActualBudgetFav/(Unfav) ActualBudgetFav/(Unfav) Cost Per Adjusted Day $2,347 $2,323 (1.0%) $ 2,752 $ 2,823 2.52% Cost Per Adjusted D/C $11,863 $11,535 (2.8%) $10,817 $11,230 3.68% FTE’s Per Adj Occp Bed 5.06 4.96 (1.96%) 5.97 5.87 (1.69%) Salary Per FTE $ 78,015 $ 79,998 2.48% $80,566 $ 85,315 5.57% Total Cost Per FTE $100,773 $104,352 3.43% $ 105,728 $111,719 5.36% OT as a % of Paid dollars 3.9% / 3.9% 3.9% / 3.9%
Women & Infants CorporationControllable ExpensesFiscal Year-to-Date as of March 2013 Variance ActualBudgetFav/(Unfav) Total Revenue $ 221,446,945 $ 217,973,887 $ 3,473,058 Salaries 96,252,190 99,717,013 3,464,823 Medical Supplies 10,659,258 10,061,978 (597,280) Drugs 7,411,953 6,838,752 (573,201) Other Expenses: Consulting 724,110 992,532 268,422 Non-Medical Supplies 611,220 584,177 (27,043) Purchased Services 9,733,125 9,934,548 201,423 Maintenance Contracts 897,648 811,451 (86,197) Repairs & Maintenance 819,391 775,356 (44,035) Food Costs 485,082 513,403 28,321 Rent Equipment 504,821 460,720 (44,101) Dues & Subscriptions 513,293 732,699 219,406 Travel & Education 437,658 633,049 195,391
Fiscal Year 2013 MetricsFiscal Year-to-Date March 2013 CNE (excludes VNA) Women & Infants March March Variance March March Variance ActualBudgetFav/(Unfav) ActualBudget Fav/(Unfav Cost Per Adjusted Day $2,364 $ 2,417 2.2% $ 2,894 $ 2,994 3.3% Cost Per Adjusted D/C $ 11,986 $ 12,018 0.3% $11,531 $11,895 3.0% FTE’s Per Adj Occp Bed 4.89 5.07 4.3% 5.62 5.94 5.4% Salary Per FTE $ 80,266 $ 80,511 0.3% $87,227 $ 88,002 0.9% Total Cost Per FTE $ 104,409 $ 104,923 0.5% $ 114,868 $ 115,715 0.7% OT as a % of Paid dollars 6.0% / 4.5% 5.5% / 3.9%