Download
1 / 37
380 likes | 545 Vues
Socioeconomic inequities in treatment and prevention of malaria in Tanga district, Tanzania. Presenter: Fred Matovu Inaugural AfHEA Conference 10-12 th March, 2009 Accra, Ghana. DeMTAP study site. Study site. Background. Malaria situation in Tanzania

E N D
Socioeconomic inequities in treatment and prevention of malaria in Tanga district, Tanzania Presenter: Fred Matovu Inaugural AfHEA Conference 10-12th March, 2009 Accra, Ghana
DeMTAP study site Study site
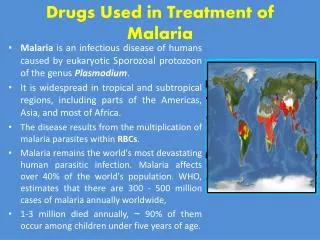
Background Malaria situation in Tanzania • Accounts for > 39% of the national disease burden • Accounts for about 48% of under5 mortality (facility –based data, 2005) • Leading diagnosis for outpatient visits • Major cause of mortality in Tanga (Lusingu, et al 2004). • Malaria prevalence higher among the poor
Effective remedies ITNs • Reduce Under5s death by 20%, saving 6 lives for every 1000 under5 in SSA. • Reduce maternal mortality, anaemia & low birth weight • Cost per DALY averted <$50 • >40% protective efficacy against clinical malaria (Ter Kuile, et al 2003) ACTs • Effective in malaria treatment
Accessibility to ITNs and ACTs • The poor are less likely to use preventive measures (Webster et al, 2005; Worrall et al, 2007, 2005; Thwing et al, 2008 etc). • RBM initiative emphasises improving ITN and ACT access for the poor • The poor cannot afford ACTs without a subsidy (Wiseman, et al 2005; Whitty et al 2008)
Bednets in Tanga By time of survey 2003-2005; • Nets were available from drug stores, pharmacies and retail shops • A net cost about 3000/=Ts( US$ 3) • Insecticide for net treatment cost ~ 0.20US$ • No subsidised nets (only a few distributed by Tanga Rotary club (very occasional)
Bednets in Tanga cont.. • After survey • Subsidised nets for pregnant women were introduced mid-2006 • Discounted voucher scheme of 75% of cost of ITN • Subsidised nets distributed in an integrated child health campaign (CHC) • Mass free distribution of nets to under-5s • Net re-treatment campaigns under CHC
Malaria treatment By survey time: • Sulfadoxine-pyrimethamine (SP) was 1st line treatment • Retail price ranging 0.30-0.50 US per adult dose • Other antimalarials included: quinine; amodiaquine, artesunate, artemether-lumefantrine ( ALU) Post-Survey • ALU is 1st line treatment (since 2006)
Study objectives To analyse socioeconomic inequalities in: • Ownership and utilisation of bednets • Obtaining AMs for reported fever
Sampling • Simple random sampling was used to select wards, villages/streets and sub-villages • 32 streets and 40 sub-villages were selected • 1603 households interviewed: (863 in rural and 740 in urban areas), Sept.03 - July 05 • 16 FGDs: (8-mothers & 8- male household heads), Dec 2006
Measurement: SES • Education class: formal schooling of household head • None • Lower primary (1-4 yrs) • Upper primary (5-7yrs) • Secondary (8-11 yrs) • Post-secondary (12+ yrs) • Asset-based wealth index (McKenzie, 2003) • PCA score for 14 household items (e.g. iron roof, bicycle, iron bed, mattress etc)
Measurement 1: Net Ownership and Utilisation • Household level – at least one net • Assumed all households in same “need” • Individual level – slept under a net night before the survey (HH roster) • Assumed Under5s are in greater “need” • ITNs: nets treated in past six months
Measurement 2: Utilisation of AMs • Obtaining an AM at health provider visited • Perceived severe fevers and Under5s were considered in greater need • Health providers considered were: • Hospital • Health centre • Dispensary • Drug shop
Result1 : Distribution of at least one net by wealth quintiles
Result 2: Distribution of at least one ITNs by wealth quintiles
Result 4: Inequalities in bednet utilisation at household level
Result 8: Proportion obtaining AMs and reporting severe fever
Result 9: Probability of obtaining an AM by treatment source
Summary of findings 1: Nets • Use of any net was higher in urban (90%) than rural areas (50%) • Use of ITNs was higher in urban (48%) than rural (9%) areas • A lot of nets in use were not treated • SES, urban location, small family size and being under5 positively associated with net use
Summary of key findings 2: Nets • Pro-rich inequalities in utilisation and ownership of any net and ITNs • Inequalities were greater in rural areas • Lack of money was major barrier to net use • Some evidence of negative perceptions for use of ITNs
Summary of findings 3: AMs • Inequalities in obtaining AMs were pro-rich overall and in rural areas • Drug shops + general shops were a major source of treatment ( >40%) • Factors positively associated with obtaining AMs: Living in urban areas; education; short distance to facility; being under5
Policy implication • Need for community-wide treatment of all nets not treated currently • Need to promote greater access of ITNs and ACTs among the poor. For example • Targeted intervention to reduce costs: discounted voucher schemes and mass ITN distribution • Encourage use of LLINs and longer-lasting net treatment • Drug subsidy incl. at drug shops • Public campaign to encourage net treatment and mitigate negative perceptions • Monitoring equity outcomes on interventions to ensure the poorest of the poor benefit
Suggestion for future research • Equity analysis in monitoring and evaluation of malaria control interventions • ITNs inequality assessment following new strategies: discounted voucher scheme +mass free distribution of ITNs Methodological • Using a range of inequality measures • Assessment of relevance of SES measure
Acknowledgements • Gates Malaria Partnership, LSHTM • For funding the DeMTAP study • Training research fellowship • AfHEA Secretariat – funding conference • DeMTAP field staff, FGDs and survey participants