Download
1 / 43
430 likes | 440 Vues
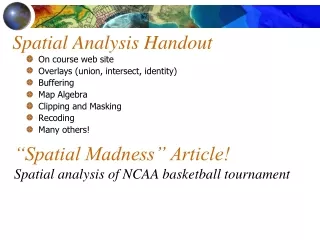
Spatial Analysis Handout. On course web site Overlays (union, intersect, identity) Buffering Map Algebra Clipping and Masking Recoding Many others!. “Spatial Madness” Article! Spatial analysis of NCAA basketball tournament Web Site of the Week. Spatial Analysis. Longley et al.

E N D
Spatial Analysis Handout • On course web site • Overlays (union, intersect, identity) • Buffering • Map Algebra • Clipping and Masking • Recoding • Many others! “Spatial Madness” Article!Spatial analysis of NCAA basketball tournament Web Site of the Week
Spatial Analysis Longley et al. Ch. 14 up to 14.3.2, Ch. 6
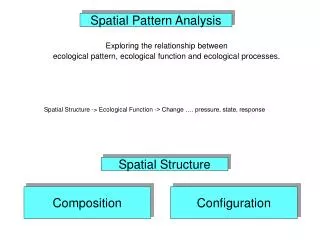
answer questions, support decisions, and reveal patterns Spatial Analysis • all of the transformations, manipulations, and methods • Data ----> Information ---> Understanding • "a set of methods whose results change when the locations of the objects being analyzed change"
calculating the average income for a group of people? calculating the center of the United States population? Which is Spatial Analysis?
Types of Spatial Analysis • Queries and reasoning • Measurements • Aspects of geographic data, length, area, etc. • Transformations • New data, raster to vector, geometric rules • Descriptive summaries • Essence of data in 1 or 2 parameters • Optimization - ideal locations, routes • Hypothesis testing - sample to entire pop.
Residential areas in flood zoneBUTneed spatial analysis to pinpoint locations GIS Analysis Model (flowchart)
2 Analysis Examples from ArcGIS • Interpolation - soil samples on a farm [transformation] • Location Analysis - coffee shops & customers [optimization]
"a set of methods whose results change when the locations of the objects being analyzed change" • Interpolation - soil samples on a farm • Location Analysis - coffee shops & customers
Interpolate samples, then query to find pH > 7Farmer needs to treat these areas w/ammonium sulfate GIS Analysis Model
pH surface [pH surface] > 7 Instead of hillshade, use raster calculator
Result: areas that farmer should treat w/ammonium sulfate to lower the pH to 7 so that soil is balanced
The Farm • Size = ~5.35 acres (233,046 sq ft. or 21,650 sq m) • Combined size of new treatment areas = ~0.145 acres (6,338 sq ft or 588 sq m) • Ammonium sulfate @ $50.00 per acre • Treat whole field - $267.50 • Treat only where needed - $7.25 • Crop yield and treatment maps over time
"a set of methods whose results change when the locations of the objects being analyzed change" • Interpolation - soil samples on a farm • Location Analysis - coffee shops & customers
Best location for new Beanery w/ location analysis ( distance & proxmity )
Marketing questions • Too close to existing shops? • Similar characteristics to existing locations? • Where are the competitors? • Where are the customers? • Where are the customers that are spending the most money?
Shops w/in 1 mile will compete for customersPotential shops > 1 mile away GIS Analysis Model
Result: yellow/orange = close to shopspurple/blue = farther away
Spending Density Function, Customer Spending
Result: Dark blues are greatest density of customer spending
Spending density ([Distance to Shops] > 5280) & ([Spending density] > .02) Find areas 1 mile from an existing shop that are also in a high spending density customer area
Result: Best locations for a new Beaneryw/ proximity to an interstate highway, zoning concerns, income levels, population density, age, etc.
Visualization & Spatial Analysis:An Example from The Districthttp://dusk.geo.orst.edu/gis/district.html More… Hot Spot Analysis: Part 1- http://bit.ly/9xIJBN Part 2- http://bit.ly/aRmN2m Part 3- http://bit.ly/bDs9Uj
Uncertainty in the Conception, Measurement, and Representation of Geographic Phenomena • Previous examples assumed it didn’t exist • Conception of Geographic Phenomena • Spatial Uncertainty - objects do NOT have a discrete, well-defined extent • Wetlands or soil boundary? • Oil spill? pollutants or damage? • Attributes - human interp. may differ
Uncertainty in Conception • Vagueness - criteria to define an object not clear • What constitutes a wetland? • An oak woodland means how many oaks? • Seafloor ages/habitats • What does a grade of “A” really mean??
Uncertainty in Conception Ambiguity - y used for x when x is missing Direct indicators: salinity (x) or species (y) Indirect more ambiguous Wetlands (y) of species diversity (x)?? Figure courtesy of Jay Austin, Ctr. For Coastal Physical Oceanography, Old Dominion U.
Uncertainty in Conception • Regionalization problems • What combination of characteristics defines a zone? • Weighting for composites? • Size threshold for zone? • Fuzzy vs. sharp
Uncertainty in Measurement • Physical measurement error • Mt. Everest is 8,850 +/- 5 m • Dynamic earth makes stable measurements difficult • Seismic motion • Wobbling of Earth’s axis • Wind and waves at sea!
Uncertainty in Measurement • Digitizing error, e.g., • Undershoots • Overshoots • “Gafs”
Uncertainty in Measurement • Misalignment of data digitized from different maps • Rubbersheeting is a corrective technique
Uncertainty in Measurement • Different lineages of data • Sample vs. population
Uncertainty in RepresentationRaster Data Structure Classification based on dominance, centrality? mixels
Uncertainty in RepresentationVector Data Structure Zones based on only a few points Points in corners of polys
Uncertainty in Analysis: The Ecological Fallacy (C) a spurious relationship between Chinese ethnicity and unemployment (B) The closure caused high unemployment, but not among the service sector workers of Chinatown • Before it closed down, the footwear factory drew its labor from its local neighborhood and a jurisdiction to the west
Uncertainty in AnalysisEcological Fallacyan overall characteristic of a zone is also a characteristic of any location or individual within the zone Factory w/no Chinese employees may have closed
Modifiable Areal Unit Problem (MAUP) • number, sizes, and shapes of zones affect the results of analysis • Many ways to combine small zones into big ones • No objective criteria for choosing one over another Path of boundary changes where high pop. is
Uncertainty of Geographic Phenomena • Conception - spatial, vagueness, ambiguity, regionalization • Measurement - field, digitizing, lineage • Representation - raster, vector • Analysis - ecological fallacy, MAUP