Download

1 / 42
420 likes | 436 Vues
Chapter 10: The t Test For Two Independent Samples. Independent-Measures Designs. Allows researchers to evaluate the mean difference between two populations using data from two separate samples .

E N D
Independent-Measures Designs • Allows researchers to evaluate the mean difference between two populations using data from two separate samples. • The identifying characteristic of the independent-measures or between-subjects design is the existence of two separate or independent samples. • Thus, an independent-measures design can be used to test for mean differences between two distinct populations (such as men versus women) or between two different treatment conditions (such as drug versus no-drug).
Independent-Measures Designs (cont'd.) • The independent-measures design is used in situations where a researcher has no prior knowledge about either of the two populations (or treatments) being compared. • In particular, the population means and standard deviations are all unknown. • Because the population variances are not known, these values must be estimated from the sample data.
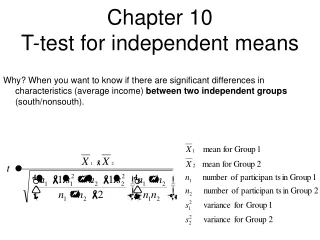
The t Statistic for an Independent-Measures Research Design • As with all hypothesis tests, the general purpose of the independent-measures t test is to determine whether the sample mean difference obtained in a research study indicates a real mean difference between the two populations (or treatments) or whether the obtained difference is simply the result of sampling error. • Remember, if two samples are taken from the same population and are given exactly the same treatment, there will still be some difference between the sample means. (i.e. sampling error)
The t Statistic for an Independent-Measures Research Design (cont'd.) • This difference is called sampling error • The hypothesis test provides a standardized, formal procedure for determining whether the mean difference obtained in a research study is significantly greater than can be explained by sampling error
n = n1 = n2 or n1 ≠ n2 • if n = n1 = n2 , • so • i.e. (10.1) = (10.4) (from p. 321 & p. 324) • if n1 ≠ n2 ,
Independent-measures t statistic • The formula for t statistic: • df = df1 + df2 = n1 + n2 – 2 • (p. 322) another formula for pooled variance:
Comparing Population Means: Unknown Population Standard Deviations (The Pooled t-test) Finding the value of the test statistic requires two steps: • Pool the sample standard deviations. • Use the pooled standard deviation to compute the t-statistic.
s2(∆M) Var( M1 – M2 ) • E(M1 – M2) = μ1 – μ2 • With independent samples / populations: • Var (M1 – M2) = Var (M1) + Var (M2) • Box 10.1 (p. 321) pop 1: X’s range = 20 pop 2: X’s range = 10 max(X1 – X2) – Min(X1 – X2) = 50 – 20 = 30
p. 325 3. I: n=4, SS=100, II: n=8, SS=140 a. b. 4. I: n=9, s2 =35, II: n=3, s2 =40 a. b. 5. df = 8 + 12 – 2 = 18
Hypothesis Tests and Effect Size with the Independent Measures t Statistic • To prepare the data for analysis, the first step is to compute the sample mean (M) and SS (or s, or s2) for each of the two samples. • The hypothesis test follows the same four-step procedure outlined in Chapters 8 and 9.
Hypothesis Testing with the Independent-Measures t Statistic (cont'd.) • Step 1. • State the hypotheses and select the α level. For the independent-measures test, H0 states that there is no difference between the two population means. • Step 2. • Locate the critical region. The critical values for the t statistic are obtained using degrees of freedom that are determined by adding together the dfvalue for the first sample and the df value for the second sample.
Hypothesis Testing with the Independent-Measures t Statistic (cont'd.) • Step 3. • Compute the test statistic. The t statistic for the independent-measures design has the same structure as the single sample t introduced in Chapter 9. However, in the independent-measures situation, all components of the t formula are doubled: there are two sample means, two population means, and two sources of error contributing to the standard error in the denominator.
Hypothesis Testing with the Independent-Measures t Statistic (cont'd.) • Step 4. • Make a decision. If the t statistic ratio indicates that the obtained difference between sample means (numerator) is substantially greater than the difference expected by chance (denominator), we reject H0 and conclude that there is a real mean difference between the two populations or treatments.
Example 10.1 (p.326) • I: n=10, M=93, SS=200 (watched..SS..) • Il: n=10, M=85, SS=160 (did not watch..SS..) • H1 : μ1≠μ2 (two-tailed test) • df = 10+10-2 = 18, α = 0.01 • critical value to mark the “rejection region”: t0.005 (18) = 2.878 • t = (93-85)/2 = 4 > 2.878 reject H0 • This is non-experimental case cannot obtain the causal relationship
Measuring Effect Size for the Independent-Measures t • Effect size for the independent-measures t is measured in the same way that we measured effect size for the single-sample t in Chapter 9. • Specifically, you can compute an estimate of Cohen’s dor you can compute r2 to obtain a measure of the percentage of variance accounted for by the treatment effect.
estimated d and r2 • estimated d: • so, d = (93 – 85) /√20 = 1.79 (very large effect!) and = 4/(4+18) = 0.47 (very large!) check p. 264 for d’s scale evaluation check p. 299 for r’s scale evaluation
Another formula for r2 • Example 10.2 (p. 329) If H0 is true, then there’s no difference between 2 populations and samples combine them into one sample: n=20, M=89, SS=680 89 is the estimator of overall μ unknown population use M=89 as μ SS1 = Σ(X-μ)2 = 680,
Calculate SS2 and r2 • and for each sample, i = 1,2 • so =200+160=360
Another formula for r2 with treatment effect: SS1 = 680 treatment effect removed: SS2 = 360 • = 320/680 = 0.47
Confidence Interval for μ1 – μ2 • Same as chapter 9:
Example 10.3 (p.331) • 95% confidence interval for example 10.1 • 1st, find the boundary t value: check t table (p.703) t0.025, 18 = 2.101 • so, = (93 – 85) 2.1012 = 8 4.202 CI = (3.798, 12.202)
Confidence Intervals and Hypothesis Tests • If CI includes 0 μ1 – μ2 = 0 is acceptable • If 0 is not included in CI μ1 – μ2 = 0 is not acceptable reject it with 95% confidence
Write a research report.... • Should include the following information in your report: - t statistic with df - p value - Cohen’s d - CI - M, SD, etc.
p. 333 1. df = 16+16-2=30, α=0.05, t0.025, 30 = 2.042 t = (86-82.5)/3 = 1.17 < 2.042 failed to reject Ho (p > 0.05) d = 3.5/√72 = 0.41248 90%CI = (86-82.5) t0.05, 303=3.5 1.6973(-1.591, 8.591) 2. df = 28 Σn = 28+2 = 30 if α=0.05, t0.025, 28 = 2.048 t statistic = 2.27 > 2.048 reject Ho (p < 0.05)
One-tailed test (example 10.4) (p. 334) • H1 : μ1 > μ2 (right-tailed test) • α = 0.01, t0.01, 18 = 2.552 • t statistic = 4 > 2.552 reject Ho significant effect (getting higher grade)
The role of s2 and n in the independent-measures t test • s2 ↑ s∆M↑ t ↓ less likely to reject Ho • n ↑ s∆M↓ t ↑ More likely to reject Ho • s2 ↑ d, r2↓ • n has no effect on d • n has small effect on r2
Example 10.5 (p. 335-336) • Fig 10.7 • sp = 1.22, • df = 9+9-2 = 16, • t = (13-8)/0.58 = 8.62 reject Ho • if s↑, other factors remain unchanged • Fig 10.8: sp = 6.65 • t = (13-8)/3.14 = 1.59 p > 0.05 failed to reject Ho
Comparing Population Means: Equal, Unknown Population Standard Deviations (The Pooled t-test) The t distribution is used as the test statistic if one or more of the samples have less than 30 observations. The required assumptions are: • Both populations must follow the normal distribution. • The samples are from independent populations. • The populations must have equal standard deviations. (homogeneity of variance) i.e. σ1 = σ2 = σ Assume: treatment added constant value to each score μ was changed, but σ was unchanged
The Homogeneity of Variance Assumption • Most hypothesis tests usually work reasonably well even if the set of underlying assumptions are violated. • The one notable exception is the assumption of homogeneity of variance for the independent-measures t test. • Requires that the two populations from which the samples are obtained have equal variances • Necessary in order to justify pooling the two sample variances and using the pooled variance in the calculation of the t statistic
The Homogeneity of Variance Assumption (cont'd.) • If the assumption is violated, then the t statistic contains two questionable values: (1) the value for the population mean difference which comes from the null hypothesis, and (2) the value for the pooled variance. • The problem is that you cannot determine which of these two values is responsible for a t statistic that falls in the critical region. • In particular, you cannot be certain that rejecting the null hypothesis is correct when you obtain an extreme value for t.
The Homogeneity of Variance Assumption (cont'd.) • If the two sample variances appear to be substantially different, you should use Hartley’s F-max test to determine whether or not the homogeneity assumption is satisfied. • If homogeneity of variance is violated, Box 10.2 presents an alternative procedure for computing the t statistic that does not involve pooling the two sample variances.
Hartley’s F-max test • Procedure for the test: 1. compute s2 for each sample 2. compute F-max large F-max unequal variances F-max close to 1 equal variances 3. find critical value in Table B.3 (p.704) sample F-max > table value unequal variances Note: k: # of samples (here, k=2) df = n-1 for each sample (Hartley test assumes all samples are the same size)
Example 10.6 (p. 339) • n=10, s2 = 12.34 and 9.15 F-max = 12.34/9.15 = 1.35 if α = 0.05, check table (p. 704): critical value of F-max = 4.03; if α = 0.01, critical value of F-max = 6.54 data do not provide evidence that homogeneity of variance assumption has been violated • If that homogeneity of variance assumption has been violated use equation (10.1) with different df
Comparing Population Means with Unknown AND Unequal Population Standard Deviations Use the formula for the t-statistic shown if it is not reasonable to assume the population standard deviations are equal. The degrees of freedom are adjusted downward by a rather complex approximation formula. The effect is to reduce the number of degrees of freedom in the test, which will require a larger value of the test statistic to reject the null hypothesis.
p. 340 1. n=8, I: M=63, s2 = 18 II: M=58, s2 = 14 a. α = 0.05 one-tailed test, df = 14, t0.05,14 = 1.761 t = (63-58)/2 = 2.5 > 1.761 reject Ho b.s2 = 68,and s2 = 60 t = (63-58)/4 = 1.25 < 1.761 failed to reject Ho c. n = 32 t = (63-58)/1 = 5 > 1.761 reject Ho