Download

1 / 42
420 likes | 425 Vues
Causal Effects in Integrative Genomics. Carlo Berzuini and Brian Tom MRC Biostatistics Unit, Cambridge. Collaboration with Alison Goodall and Chris Jones, Department of Cardiovascular Sciences, University of Leicester Cambridge, December 2006. Aim.

E N D
Causal Effects in Integrative Genomics Carlo Berzuini and Brian Tom MRC Biostatistics Unit, Cambridge Collaboration with Alison Goodall and Chris Jones, Department of Cardiovascular Sciences,University of Leicester Cambridge, December 2006
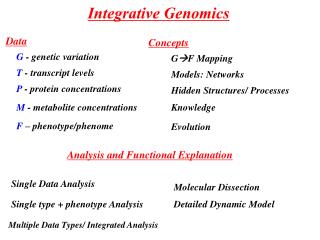
Aim • estimating the (causal) effect of endophenotypes on • a disease condition of interest • Endophenotype = inheritable, measurable • characteristic along the pathway from genes to a • disease condition of interest • e.g.effect of platelet aggregation on risk of • thrombosis • in order to: • inform medical interventions, help discovering new • drug targets, predict adverse clinical events, improve • power to detect genetic effects….
ENDOPHENOTYPEDISEASE Presence of prion proteins vCJD Tubulointerstitial fibrosis Renal High platelet reactivity Thrombosis Fibrinogen level CHD …….. ……..
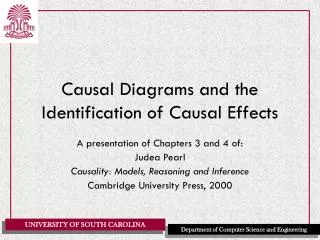
Outline • Causation vs statistical association • Reverse causation, confounding, ….. • Causality and Probabilistic Graphical models • A formal graphical method to assess estimability of causal effects in the context of functional genomics experiments • Illustrative examples
Difficulty: association IS NOT causation In fact: A and B may be associated, but an intervention on A have no effect on B , and viceversa Want to establish whether the associations we observe under a given observational regime, i.e., our data, allow us to infer causal relationships
Example 1 We observe a positive association between infections in early life and asthma. Someone interprets this to indicate that former “cause” the latter. ? early infections asthma However, there is also evidence that asthma may itself cause an increased risk of infections, and that asthmatics are likely to carry an inheritable defective response to rhinovirus, making them more vulnerable to rhinovirus infection (Pekkanen, 2004) early infections asthma Rhinovirus response genotype
Example 2 Some authors claim evidence that moderate alcohol consumption protects from heart disease: moderate alcohol vs no alcohol heart disease protects from But confounders might be operating: moderate alcohol heart disease positive attitude towards life events
Example 2 (continued) There is statistical evidence that people with an ADH3 mutation, provided they are not heavy drinkers, are at lower risk of heart disease. In this people clearance of alcohol is slower, resulting in an higher exposure to alcohol. Hence the association between ADH3 mutation and lower incidence of heart disease proves that an increased exposure to alcohol is cardio-protective. higher exposure to alcohol slow alcohol clearance ADH3 mutation heart disease confounders
Probabilistic directed graphical models express the conditional independence relationships among the domain variables in the form of a directed acyclic graph (DAG). intermediate phenotype measured covariates Z C X Y genotype clinical outcome
Z C X Y Implied conditional independence properties of the joint distribution over the graph can be read off the graph by the moralization criterion
Moralization criterion(Lauritzen et al., 1990) Suppose we want to ascertain whether First we remove any node which is neither in nor an ancestor of a node in this set. Then we add a line between any two nodes with a common child, if they are not already connected. Finally, we remove arrowheads.
Unmoralized Z C X Y Moralized Z C X Y
To check Z C X Y look for a path between X and Y that does not intersect Z. If there is no such path, the above relationship is true.
Traditional DAGs not sufficiently expressive to reason about causes and effects of causes P(Y | X=x) is in general different from what Pearl denotes as P(Y | do(X=x)) that is, the distribution of Y following an intervention that sets X to take a specific value x.
Augment the DAG by addingintervention nodes The value of the intervention node, Fz , indicates what type of intervention is performed on Z. Fz Z C X Y
Intervention node/indicator Fz=z Z C X Y
INTERVENTION DISTRIBUTION • P(Y|Fx=x) denotes the distribution of Y when we intervene by setting X to take value x. • Causal effect of X on Y measured by an appropriate contrast between P(Y|Fx=x) and P(Y|Fx=x*), where x* is a chosen reference or baseline value
Average Causal Effect Let x* represent a baseline value of X. Then the AverageCausalEffect on Y due to setting X to be equal to x, is defined by ACE(X, Y) = E(Y| Fx=x) - E(Y| Fx=x*) ACE is straightforwardly estimated in a controlled experimental setting where we have the power to fix the value of X and then observe the resulting Y. Given that we have a specific, non-necessarily experimental, set of data, how do we determine whether we can estimate a specific ACE ?
Estimability of a causal effect from observational data: theback-door criterion (Pearl, 1999)
C FT T X Y Back-door conditions for ACE(T,Y) satisfied: satisfied satisfied
U unobserved FT T X Y Back-door conditions for ACE(T,Y): satisfied not satisfied
A typical observational scenario intermediate phenotype U unobserved Fz Z X Y clinical outcome genotype cannot estimate the causal effect of Z on Y, because a back-door condition is violated
intermediate phenotype U unobserved Fz Z X Y clinical outcome genotype However, we can measure the association between X and Y. If significant, it implies that Z causally influences Y. Causal effect of Z on Ycannot be measured, unless under strict parametric assumptions (instrumental variable method).
A more realistic scenario intermediate phenotype U unobserved confounders Fz Z X Y clinical outcome genotype H W unobserved population stratification causal variant
“No unobserved confounders between intermediate phenotype and clinical outcome” intermediate phenotype U unobserved Fz Z X Y clinical outcome genotype W unobserved
intermediate phenotype U unobserved Fz Z Y X clinical outcome genotype W unobserved Causal effect of Z upon Y estimated via: Effect of X upon Y estimated via:
“No unobserved confounders between • intermediate phenotype and clinical outcome” • This condition can be approximated by choosing an intermediate phenotype (Z) that: • is relevant to disease • is inheritable • is pathway-specific (typically involving in vitro experiments) • in vitro response should accurately reflect in vivo response • is reproducible (rank preserving)
Several genes: qz qy intermediate phenotype Fz Z U unobserved Y X1 genotype clinical outcome …. genotype XK W unobserved
Illustrative study: the role of platelet in the genesis of occlusive thrombosis
The medical problem: carotid endarterectomy surgery removes the plaque that narrows neck arteries and increases the risk of stroke. This surgery is associated with a risk of stroke after the procedure, due to tiny clots called microemboli that break off the surface of the cleaned artery. Scientific question: why do some patients appear to be at higher risk of forming these blood clots, and of dying as a consequence of this ? Causal hypothesis: some patients might be at high risk because their blood platelets, the cells which initiate clotting, are highly sensitive to a chemical called collagen. Such a hypersensitivity is likely to be a genetically inheritable trait.
Study sample Collaboration with: Prof Ross Naylor, Prof Alison Goodall, Mr Paul Hayes, Mr David Payne and Mr Chris Jones, Department of Cardiovascular Sciences at the University of Leicester. 260 carotid endarterectomypatients Each patient characterized by: • number of post-operative emboli (detected via transcranial Doppler) • multilocus unphased genotypes at seven candidate genes that code for platelet membrane receptors involved in the clotting response • in vitro measurements of platelet reactivity (described next) under collagen stimulation
collagen molecule and its receptors platelet
collagen molecule and its receptors Calcium concentration collagen binding activates a signalling cascade, leading to an increased concentration of calcium
collagen molecule and its receptors p-selectin Calcium concentration An increase in calcium concentration pushes p-selectin proteins outside the membrane platelet becomes “sticky”
fibrinogen molecules collagen molecule and its receptors Calcium concentration Because platelet is now sticky, a lot of fibrinogen molecules adhere to it. This favours platelet aggregation
Measuring platelet reactivity Stimulate platelet by in vitro exposure to different doses of collagen Measure fibrinogen binding • highly inheritable, highly pathway specific, highly reproducible • in vitro response accurately reflects in vivo response
Incorporating genotype information Each individual typed at several SNP in the coding region of each of the known types of receptor involved in collagen binding. In total, we considered 7 multilocus genotypes corresponding to 7 unlinked genes. In the future we shall include genotypes, and expression levels, for more than 100 genes known to belong to the relevant pathways and/or with highly differential expression between groups of individuals with extreme platelet response
qz qy hyperreactive ? (YES/NO) Z unobserved U Y number of emboli >25 (YES/NO) X1 genotype …. genotype X7 W unobserved
Preliminary results of our analysis highlight the role of non-synonimous mutations in the GPVI collagen receptor: odds-ratio of hyperreactivity vs GPVI mutation ACE(hyperreactive,no.emboli)
References Judea Pearl: Causality, Cambridge University Press, 2000 Phil Dawid: Causal inference without counterfactuals (with Discussion). Journal of the American Statistical Association, 95, 407-48, 2000 Jones et al.: Mapping the platelet profile for functional genomic studies. Submitted to Circulation, 2006 Didelez,V. and Sheehan, N.: Mendelian randomisation and instrumental variables: what can and what can’t be done. Research Report. Department of Health Sciences, University of Leicester, 2006.