Download
1 / 50
500 likes | 628 Vues
HIV/AIDS Prevalence & Mortality Report, 2012. Minnesota Department of Health HIV/AIDS Surveillance System. Introduction (I). HIV/AIDS in Minnesota: Annual Review. Introduction (II). HIV/AIDS in Minnesota: Annual Review. Introduction (III).

E N D
HIV/AIDS Prevalence & Mortality Report, 2012 Minnesota Department of Health HIV/AIDS Surveillance System
Introduction (I) HIV/AIDS in Minnesota: Annual Review
Introduction (II) HIV/AIDS in Minnesota: Annual Review
Introduction (III) HIV/AIDS in Minnesota: Annual Review
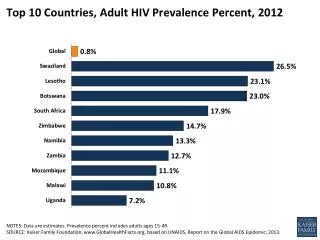
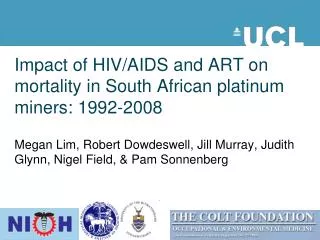
National Context HIV/AIDS in Minnesota: Annual Review
Overview of HIV/AIDS in Minnesota HIV/AIDS in Minnesota: Annual Review
HIV/AIDS in Minnesota:New HIV Infection, HIV (non-AIDS) and AIDS Cases by Year, 2003-2012 *Includes all new cases of HIV infection (both HIV (non-AIDS) and AIDS at first diagnosis) diagnosed within a given calendar year. ^Includes all new cases of AIDS diagnosed within a given calendar year, including AIDS at first diagnosis. This includes refugees in the HIV+ Resettlement Program, as well as, other refugee/immigrants diagnosed with AIDS subsequent to their arrival in the United States.
Persons Living with HIV/AIDS in Minnesota HIV/AIDS in Minnesota: Annual Review
As of December 31, 2012, 7,516* persons are assumed alive and living in Minnesota with HIV/AIDS 3,974 living with HIV infection (non-AIDS) 3,542 living with AIDS This number includes 1,654persons who were first reported with HIV or AIDS elsewhere and subsequently moved to Minnesota This number excludes 1,112 persons who were first reported with HIV or AIDS in Minnesota and subsequently moved out of the state Estimated Number of PersonsLiving with HIV/AIDS in Minnesota * This number includes persons who reported Minnesota as their current state of residence, regardless of residence at time of diagnosis. Includes state prisoners and refugees arriving through the HIV+ Refugee Resettlement Program, as well as HIV+ refugee/immigrants arriving through other programs.
Place HIV/AIDS in Minnesota: Annual Review
Number Living with HIV/AIDS None 1-20 21-100 101-500 501-1000 1000-2000 2001-4190 Living HIV/AIDS Cases by County of Residence, 2012 City of Minneapolis – 2,943 City of St. Paul – 1,025 Suburban# – 2,393 Greater Minnesota – 1,111 Total number = 7,472 (44 people missing residence information) #7-county metro area, excluding the cities of Minneapolis and St. Paul
Number Living with HIV/AIDS None 1-20 21-100 101-500 501-1000 1000-2000 2001-4190 Map of Metro Area:Living HIV/AIDS Cases by County of Residence, 2012 City of Minneapolis – 2,943 City of St. Paul – 1,025 Suburban# – 2,393 Total number (Metro only) = 6,361 #7-county metro area, excluding the cities of Minneapolis and St. Paul * Counties in which a state correctional facility is located.
Persons Living with HIV/AIDS in Minnesotaby Current Residence, 2012 Total Number =7,472 (44 persons missing residence information) Suburban = Seven-county metro area including Anoka, Carver, Dakota, Hennepin (except Minneapolis), Ramsey (except St. Paul), Scott, and Washington counties. Greater MN = All other Minnesota counties, outside the seven-county metro area.
Gender and Race/Ethnicity HIV/AIDS in Minnesota: Annual Review
Persons Living with HIV/AIDS in Minnesota by Gender, 2012 5,771 (77%) 1,745 (23%)
Persons Living with HIV/AIDS in Minnesotaby Gender and Race/Ethnicity, 2012 Males (n = 5,771) Females (n = 1,745) n = Number of persons Afr Amer = African American (Black, not African-born persons) Afr born = African-born (Black, African-born persons) Amer Ind = American Indian Other = Multi-racial persons or persons with unknown race
Number of Cases and Rates (per 100,000 persons) of Persons Living with HIV/AIDS by Race/Ethnicity† – Minnesota, 2012 Census Data used for rate calculations. † “African-born” refers to Blacks who reported an African country of birth; “African American” refers to all other Blacks.. †† Estimate of 72,930 Source: Retrieved from MNCompass.org on 3/22/12. Additional calculations by the State Demographic Center. ^ Other = Multi-racial persons or persons with unknown race
Number of Cases and Rates (per 100,000 persons) of Adults and Adolescents* Living with HIV/AIDS by Gender/Risk†, Minnesota, 2012 • *HIV or AIDS at first diagnosis over the age of 13; • 2010 U.S. Census Data for persons age 13 and over used for rate calculations. • †“MSM” refers to both MSM and MSM/IDU. †† Estimate of 92,788
Age HIV/AIDS in Minnesota: Annual Review
Persons Living with HIV/AIDS in Minnesotaby Age Group†, 2012 † Age missing for 8 people .
Persons Living with HIV/AIDS in Minnesotaby Age† and Gender, 2012 Males (n = 5,766) Females (n = 1,744) n = Number of persons † Age missing for 6 people .
Mode of Exposure HIV/AIDS in Minnesota: Annual Review
Males Living with HIV/AIDS in Minnesotaby Estimated Mode of Exposure†, 2012 White Males (n = 3,410) n = Number of persons MSM = Men who have sex with men Other = Hemophilia, transplant, transfusion, mother w/ HIV or HIV risk IDU = Injecting drug use Heterosex = Heterosexual contact † Mode of Exposure has been estimated using prevalent cases with known risk. For additional detail see the HIV Prevalence & Mortality Technical Notes.
Males Living with HIV/AIDS in Minnesotaby Estimated Mode of Exposure†, 2012 African American Males†† (n = 1,140) n = Number of persons MSM = Men who have sex with men Other = Hemophilia, transplant, transfusion, mother w/ HIV or HIV risk IDU = Injecting drug use Heterosex = Heterosexual contact † Mode of Exposure has been estimated using prevalent cases with known risk. For additional detail see the HIV Prevalence & Mortality Technical Notes. †† Refers to Black, African American (not African-born) males.
Males Living with HIV/AIDS in Minnesotaby Estimated Mode of Exposure†, 2012 Hispanic Males (n = 531) n = Number of persons MSM = Men who have sex with men Other = Hemophilia, transplant, transfusion, mother w/ HIV or HIV risk IDU = Injecting drug use Heterosex = Heterosexual contact † Mode of Exposure has been estimated using prevalent cases with known risk. For additional detail see the HIV Prevalence & Mortality Technical Notes.
Males Living with HIV/AIDS in Minnesotaby Estimated Mode of Exposure†, 2012 African-born Males†† (n = 445) n = Number of persons MSM = Men who have sex with men Other = Hemophilia, transplant, transfusion, mother w/ HIV or HIV risk Heterosex = Heterosexual contact † Mode of Exposure has been estimated using the following breakdown: 5% - MSM, 90% - Heterosex, and 5% - Other. For additional detail see the HIV Prevalence & Mortality Technical Notes. †† Refers to Black, African-born males.
Males Living with HIV/AIDS in Minnesotaby Estimated Mode of Exposure†, 2012 American Indian Males (n = 75) n = Number of persons MSM = Men who have sex with men Other = Hemophilia, transplant, transfusion, mother w/ HIV or HIV risk IDU = Injecting drug use Heterosex = Heterosexual contact † Mode of Exposure has been estimated using prevalent cases with known risk. For additional detail see the HIV Prevalence & Mortality Technical Notes.
Males Living with HIV/AIDS in Minnesotaby Estimated Mode of Exposure†, 2012 Asian Males (n = 97) n = Number of persons MSM = Men who have sex with men Other = Hemophilia, transplant, transfusion, mother w/ HIV or HIV risk IDU = Injecting drug use Heterosex = Heterosexual contact † Mode of Exposure has been estimated using prevalent cases with known risk. For additional detail see the HIV Prevalence & Mortality Technical Notes.
Males Living with HIV/AIDS in Minnesotaby Estimated Mode of Exposure†, 2012 Multi-racial Males (n = 65) CAUTION: Small number of cases – interpret carefully. n = Number of persons MSM = Men who have sex with men Other = Hemophilia, transplant, transfusion, mother w/ HIV or HIV risk IDU = Injecting drug use Heterosex = Heterosexual contact † Mode of Exposure has been estimated using prevalent cases with known risk. For additional detail see the HIV Prevalence & Mortality Technical Notes.
Females Living with HIV/AIDS in Minnesotaby Estimated Mode of Exposure†, 2012 African American Females†† (n = 506) n = Number of persons Other = Hemophilia, transplant, transfusion, mother w/ HIV or HIV risk IDU = Injecting drug use Heterosex = Heterosexual contact † Mode of Exposure has been estimated using prevalent cases with known risk. For additional detail see the HIV Prevalence & Mortality Technical Notes. †† Refers to Black, African American (not African-born) females.
Females Living with HIV/AIDS in Minnesotaby Estimated Mode of Exposure†, 2012 African-born Females†† (n = 560) n = Number of persons Other = Hemophilia, transplant, transfusion, mother w/ HIV or HIV risk IDU = Injecting drug use Heterosex = Heterosexual contact † Mode of Exposure has been estimated using the following proportions: 95% - Heterosexual, 5% - Other. For additional detail see the HIV Prevalence & Mortality Technical Notes. †† Refers to Black, African-born females.
Females Living with HIV/AIDS in Minnesotaby Estimated Mode of Exposure†, 2012 White Females (n = 438) n = Number of persons Other = Hemophilia, transplant, transfusion, mother w/ HIV or HIV risk IDU = Injecting drug use Heterosex = Heterosexual contact † Mode of Exposure has been estimated using prevalent cases with known risk. For additional detail see the HIV Prevalence & Mortality Technical Notes.
Females Living with HIV/AIDS in Minnesotaby Estimated Mode of Exposure†, 2012 Hispanic Females (n = 111) n = Number of persons Other = Hemophilia, transplant, transfusion, mother w/ HIV or HIV risk IDU = Injecting drug use Heterosex = Heterosexual contact † Mode of Exposure has been estimated using prevalent cases with known risk. For additional detail see the HIV Prevalence & Mortality Technical Notes.
Females Living with HIV/AIDS in Minnesotaby Estimated Mode of Exposure†, 2012 American Indian Females (n = 57) CAUTION: Small number of cases – interpret carefully. n = Number of persons Other = Hemophilia, transplant, transfusion, mother w/ HIV or HIV risk IDU = Injecting drug use Heterosex = Heterosexual contact † Mode of Exposure has been estimated using prevalent cases with known risk. For additional detail see the HIV Prevalence & Mortality Technical Notes.
Females Living with HIV/AIDS in Minnesotaby Estimated Mode of Exposure†, 2012 Asian Females (n = 40) CAUTION: Small number of cases – interpret carefully. n = Number of persons Other = Hemophilia, transplant, transfusion, mother w/ HIV or HIV risk IDU = Injecting drug use Heterosex = Heterosexual contact † Mode of Exposure has been estimated using the following proportions: 95% - Heterosexual, 5% - Other. For additional detail see the HIV Prevalence & Mortality Technical Notes.
Females Living with HIV/AIDS in Minnesotaby Estimated Mode of Exposure†, 2012 Multi-racial Females (n = 31) CAUTION: Small number of cases – interpret carefully. n = Number of persons Other = Hemophilia, transplant, transfusion, mother w/ HIV or HIV risk IDU = Injecting drug use Heterosex = Heterosexual contact † Mode of Exposure has been estimated using the following proportions: 95% - Heterosexual, 5% - Other. For additional detail see the HIV Prevalence & Mortality Technical Notes.
Special Populations HIV/AIDS in Minnesota: Annual Review
Foreign-Born Persons Living with HIV/AIDS in Minnesota by Region of Birth, 2003-2012 Region of Birth Latin Amer/Car – Includes Mexico, Caribbean, and Central/South American countries
African-Born† Persons Living with HIV/AIDS Compared to Other Minnesota Cases by Gender, 2012 U.S.-born Cases Total Number = 5,982 African-born Persons Total Number = 1,008 † Includes persons arriving to Minnesota through the HIV+ Refugee Resettlement Program and other refugee/immigrant programs. Also includes 1 White African-born persons and 2 multi-racial African-born person.
U.S.-born Cases Total Number = 5,982 Persons Living with HIV/AIDS born in Latin America/Caribbean† Countries Compared to Other Minnesota Cases by Gender, 2012 Latin/Caribbean Persons Total Number = 378 † Includes Mexico and all Central/South American and Caribbean countries.
Countries of Birth Among Foreign-Born Persons† Living with HIV/AIDS, Minnesota, 2012 † Includes persons arriving to Minnesota through the HIV+ Refugee Resettlement Program, as well as other refugee/immigrants with an HIV diagnosis prior to arrival in Minnesota. ^ Includes 90 additional countries.
Mortality HIV/AIDS in Minnesota: Annual Review
Reported Deaths* among Male MN AIDS Cases 1996-2012 * Deaths among MN AIDS cases, regardless of location and cause.
Reported Deaths* among Female MN AIDS Cases 1996-2012 * Deaths among MN AIDS cases, regardless of location and cause.
Reported Deaths* in Minnesota among Males with HIV Infection†, 1996-2012 * Deaths in Minnesota among people with HIV infection regardless of location of diagnosis and cause of death. † HIV (non-AIDS) or AIDS
Reported Deaths* in Minnesota among Females with HIV Infection†, 1996-2012 * Deaths in Minnesota among people with HIV infection regardless of location of diagnosis and cause of death. † HIV (non-AIDS) or AIDS