Download
1 / 18
180 likes | 290 Vues
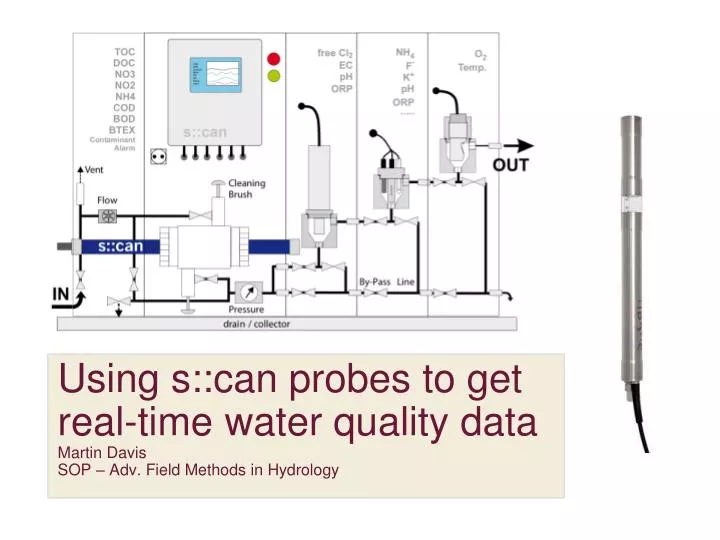
Using s::can probes to get real-time water quality data Martin Davis SOP – Adv. Field Methods in Hydrology. Why monitor in the field?. Allows capture of data as notable events occur No need to transport samples back to the laboratory Fewer concerns with contamination risk

E N D
Using s::can probes to get real-time water quality dataMartin DavisSOP – Adv. Field Methods in Hydrology
Why monitor in the field? • Allows capture of data as notable events occur • No need to transport samples back to the laboratory • Fewer concerns with contamination risk • Gives ability to more easily characterize changes and trends • Provides mobility for assessors without fixed locations • Allows for continuous monitoring of remote locations • Gives the ability to share data in real-time with collaborators • Provides rapid response ability for water contamination events
Who is using this technology? • USGS: Tracking Nitrate in the Mississippi River • Vienna Waterworks: Drinking water QC • Arizona Dairy Industry: Reducing plant waste • Indian Government: Monitoring contamination in the Ganges river during Kumbh Mela festival • Virginia Tech: BSE department using it to track micronutrient levels in local streams
Protocols: Part 1 – Site Selection Select an appropriate site: Factors to consider for site selection include: SITE CHARACTERISTICS • Potential for water-quality measurements at the site to be representative of the monitored system. • Cross-section variation and vertical stratification. • Unique constraints of channel configuration. • Range of stream stage (from low flow to flood) that can be expected over the measurement interval • Presence of existing monitoring or surveillance. • Water velocity. • Presence of turbulence. • Conditions that may enhance the rate of fouling, such as excessive fine sediments or algaeThis is particularly important for spectroscopy. • Range of values for water-quality field parameters. • Need for protection from debris damage. • Need for protection from vandalism. MONITOR INSTALLATION • Type of state or local permits required • Safety hazards relevant to monitor construction • Optimal type and design of installation. • Consideration of installation challenges/costs. LOGISTICS (MAINTENANCE REQUIREMENTS) • Accessibility of site. • Safe and adequate maintenance space. • Presence of conditions that increase the frequency of servicing intervals needed to meet data-quality. • For stream sites, proximity to an adequate location for making cross-section measurements. • Accessibility and safety of the site during extreme events (for example, floods or high winds). • Availability of electrical power or telephone service. • Need for real-time reporting.
Protocols: Part 2 – Instrument Choice • S::can instruments have many probes. • All interface with a central control unit. • Choice depends on things like cost & desired monitoring. • Spectrometer is the most robust, but the most difficult to configure & costly.
Protocols: Part 3 – Installation Types • Pipes are convenient when there are existing monitoring stations in place at a survey site. • Cages are easily transportable and inexpensive. They can provide some instrument protection, though not as much as fixed installations.
Protocols: Part 3 – Installation Types • Fixed-site pumped deployment is ideal if there is already a long-term installation available. It provides the maximum access control, and sensor protection. Costly. • Buoys are mobile like cages and are more robust, but can be pushed off course if anchors break away.
Protocols: Part 4 – Port Access For this type of monitoring to work, sensors must be clean & exposed: Mounting Options and Requirements • Water must pass evenly through the instrument gap to be accurately measured by spectroscopy. • Horizontal orientation decreases bubbles and sediment in the probe. • Secure installation prevents sensors from knocking into objects. • Vertical orientation is easier to put into place but cables must besecured against damage. Cleaning and Anti-Fouling Options • Screens may be used to prevent larger particles from entering the sensor. Certain metals such as copper also exhibit anti-fouling properties to prevent algal growth. • Polymer coats can inhibit deposition and microbial growth. • Wipers or brushes can be very effective at removing stubborn deposits but require power and maintenance. • Air blasts are easily automated and often have built in ports on the instruments. • Pumping water through a flow chamber at a gage house is ideal for controlling fouling and cleaning, but it is costly.
Protocols: Part 5 – Power & Cables Issues in controlling power to a field spectroscopy system • Power cable length, thickness, and quality of insulation are essential in achieving a steady input voltage necessary for continuous operation of the instruments. • Degradation of battery terminals and sensor connectors is a common problem. • Solar cells can provide a means to recharge a battery, but they are not perfect. • In permanent installations, wired power systems are an option. • Depending on the probe, output can be either analog or digital. Considerations like cable shielding are necessary for long cables with analog output. Left: An example of corroded battery terminals. Corrosion like this will impact instrument function. Periodic cleaning of contacts is necessary in the field, especially in sites with saltwater.
Protocols: Part 6 – Communications Collecting and sending data from a field unit to a central repository Data from the probes is stored on a monitoring unit in one of two configurations: con::cube • One box solution for data logging and instrument monitoring. Mini-PC with many I/O options. • Touch screen interface with plug and play options for s::can peripherals. • Data output via built-in USB, WIFI, Ethernet, or cellular modem (with SIM card and data plan). • Can interface with third party sensors through expansion ports in industrial settings con::nect • Allows use of a standalone computer to control the instrumentation and data collection. Allows flexibility in fixed installations and eliminates the need to transfer data to a PC for processing. Both the con::cube and the con::nect use the moni::tool software, either running on the user’s PC or cube. An online demonstration of the moni::tool web interface is available at: http://monitool.s-can.at/index.x.
Protocols: Part 7 – Data Quality Ensuring that data is useful and filtering out noise and interference Interference from dissolved constituents • Dissolved constituents which absorb light at similar wavelengths to the desired analyte can disrupt measurements obtained through spectroscopy. Their presence will increase absorptivity. • In nitrate, for example, dissolved organic carbon, bromide, hydrogen sulfide, and other types of compounds can produce this type of interference. Advantages of using an s::can spectrometer over a conventional single or dual wavelength sensor allows for more complex spectral filtering. Interference from suspended particles • Suspended particles will scatter light and can result in overestimating absorbance. • This scattering can vary and change both magnitude and shape of a curve. • High turbidity values can prevent an instrument from functioning beyond a certain threshold.
Protocols: Part 7 – Data Quality Ensuring that data is useful, and filtering out noise and other undesirable effects Interference from dissolved constituents Interference from suspended particles (Both actual nitrate concentrations are in 1mg/L as Nitrogen)
Protocols: Part 7 – Data Quality Reading a spectral fingerprint and compensating for background values • This figure presents a spectral fingerprint example with both filtered and non-filtered spectra. • Compensating is typically done at the hardware level on most control units. • Algorithms are dependent on the contents of the water and must be updated for new sites. • In the Easton Lab, our work originally used calibrations for wastewater effluent which had to be adjusted by the company to function properly in a stream.
Protocols: Part 7 – Data Quality Other items worthy of consideration when processing field data Sampling Interval vs. Reporting Interval • How often do you want the instrument to take each measurement? • Additionally, when reporting this data, do you want instantaneous values or a mean over a short measurement interval (to account for moment-to-moment fluctuations in absorption values) Understanding detection limitations for various instruments, algorithms, and media • Bias can occur as discussed before due to turbidity or dissolved solids. It can also occur due to wear on the instrument, a dirty aperture, and a lamp which no longer provides enough light. • Bias can be accounted for with correction algorithms. • For the S::CAN spectro::lyser probe, the maximum error for bias correction is: ±6% of reading plus 3/optical path length (in mm; mg/L). Ranges of data validity Turbidity: 0–50 NTU, precision 0.05 NTU Nitrite (NO2-N): 0–7 mg/L, precision 0.005 mg/L abs/m DOC: 0–6 mg/L, precision 0.003 mg/L Ozone: 0 –10 mg/L, precision 0.005 mg/L Nitrate (NO3-N): 0–7 mg/L, precision 0.005 mg/L TOC: 0–8 mg/L, precision 0.005 mg/L Spectral Absorption (SAC254): 0–25 abs/m, precision 0.015 Color: 0–250 Hazen, precision 0.1 Hazen
Protocols: Part 9 – Troubleshooting From the USGS guide to optical techniques for determination of nitrate in situ. These guidelines are applicable in many cases to a variety of target analytes when using s::can units.
Protocols: Part 8 – Maintenance Performing diagnostics and maintaining quality data collection Remote Access • Regular review of data collected by the instrument. • Regular checking of sensor indicators (lamp hours, noise levels, power, internal temperature). • Regular checking of system indicators (storage remaining, data transmission). • Flagging abnormal data for review. • Modifying the data collection and processing parameters as necessary. Field Access • Inspections for damage, fouling, and corrosion on instrument and all connections. • Cleaning and servicing sensors as needed. • Checking the battery, solar panels, inverters, or other power components. • Downloading data and diagnostic information as necessary. • Manual sample collection for comparison to ensure data validity.
References • Pellerin, B.A., Bergamaschi, B.A., Downing, B.D., Saraceno, J.F., Garrett, J.A., and Olsen, L.D., 2013, Optical techniques for the determination of nitrate in environmental waters: Guidelines for instrument selection, operation, deployment, maintenance, quality assurance, and data reporting: U.S. Geological Survey Techniques and Methods 1–D5, 37 p. • Lane, S.L., and Fay, R.G., 1997, Safety in field activities: U.S. Geological Survey Techniques of Water-Resources Investigations, book 9, chap. A9, October 1997, accessed Nov. 1, 2013, at http://pubs.water.usgs.gov/twri9A9/. • Wagner, R.J., Boulger, R.W., Jr., Oblinger, C.J., and Smith, B.A., 2006, Guidelines and standard procedures for continuous water-quality monitors—Station operation, record computation, and data reporting: U.S. Geological Survey Techniques and Methods 1–D3, 51 p. • Langergraber, G., N. Fleischmann, F. Hofstaedter, and A. Weingartner. 2004. Monitoring of a paper mill wastewater treatment plant using UV/VIS spectroscopy. Water science and technology : A journal of the International Association on Water Pollution Research 49(1):9. • U.S. EPA. Technology Evaluation Report, s::can Measuring Systems Spectro::lyser. U.S. Environmental Protection Agency, Washington, DC, EPA/600/R-12/065, 2012.