Download
1 / 43
430 likes | 621 Vues
The WVR at Effelsberg. Alan Roy Reinhard Keller Ute Teuber Dave Graham Helge Rottmann Walter Alef Thomas Krichbaum. The Scanning 18-26 GHz WVR for Effelsberg. = 18.5 GHz to 26.0 GHz D = 900 MHz Channels = 24 T receiver = 200 K sweep period = 6 s

E N D
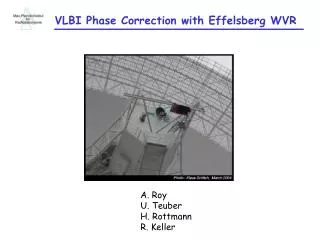
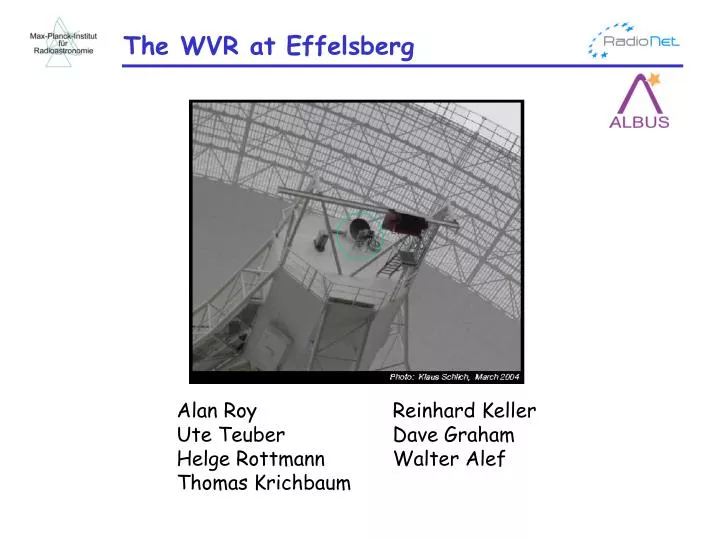
The WVR at Effelsberg Alan Roy Reinhard Keller Ute Teuber Dave Graham Helge Rottmann Walter Alef Thomas Krichbaum
The Scanning 18-26 GHz WVR for Effelsberg = 18.5 GHz to 26.0 GHz D = 900 MHz Channels = 24 Treceiver = 200 K sweep period = 6 s rms = 61 mK per channel Features Uncooled (reduce cost) Scanning (fewer parts, better stability) Robust implementation (weather-proof, temperature stabilized) Noise injection for gain stabilization Beam matched to Effelsberg near-field beam TCP/IP communication Web-based data access Improved version of prototype by Alan Rogers
The Scanning 18-26 GHz WVR for Effelsberg Front-end opened March 16th, 2004 Ethernet data acquisition system Temperature regulation modules Control unit
WVR Performance Requirements Phase Correction Aim: coherence = 0.9 requires / 20 (0.18 mm rms at = 3.4 mm) after correction Need: thermal noise 14 mK in 3 s Measured: 12 mK = 0.05 mm Need: gain stability 3.9 x 10⁻⁴ in 300 s Measured: 2.7 x 10⁻⁴ Opacity Measurement Aim: correct visibility amplitude to 1 % (1 ) Need: thermal noise 2.7 K Measured: 12 mK Need: absolute calibration 14 % (1 ) Measured: 5 %
WVR View of Atmospheric Turbulence Zenith sky (clear blue, dry, cold) Absorber 12 h 1 h ● gain stability: 2.7x10⁻⁴ over 400 s ● sensitivity: 61 mK for τint = 0.025 s (0.038 mm rms path length noise for τint = 3 s)
Move to Effelsberg March 20th, 2003
Spillover Cal: Skydip with Absorber on Dish detector output 0 V to 0.3 V el = 90◦ to 0◦ 19 to 26 GHz
Gain Calibration Measure: hot load sky dip at two elevations noise diode on/off Derive: Tsky Treceiver gain
WVR Beamwidth: Drift-Scan on Sun 26.0 GHz beamwidth = 1.26◦ 18.0 GHz beamwidth = 1.18◦
WVR Beam Overlap Optimization Atmospheric WV Profiles at Essen from Radiosonde launches every 12 h (courtesy Dr. S. Crewell, Uni Cologne) WVR – 100 m RT Beam Overlap for three WV profiles
WVR Noise Budget for Phase Correction Thermal noise: 75 mK in the water line strength, April 2003 186 mK per channel on absorber, scaled to 25 channels difference on-line and off-line channels (34 mK in Feb 2004 due to EDAS hardware & software upgrade) Gain changes: 65 mK in 300 s 2.7x10⁻⁴ multiplies Tsys of 255 K Elevation noise: 230 mKtypical elevation pointing jitter is 0.1◦ sky brightness gradient = 2.8 K/◦ at el = 30◦ Beam mismatch: 145 mKmeasured by chopping with WVR between two sky positions with 4◦ throw, Aug 2003 4◦ = 120 m at 1.5 km and el = 60◦ 66 mK to 145 mK Sramek (1990), VLA structure functions 95 mK Sault (2001), ATCA 2001apr27 1700 UT Other ?Spillover model errors, cloud liquid water removal, RFI, wet dish, wet horn Total (quadrature): 290 mK = 1.3 mm rms
Move to Focus Cabin March 16th, 2004
WVR Beam Geometry Beam overlap, April 2003 Beam overlap, April 2004
Optical Alignment using Moon 23 K Tantenna = 23 K Tmoon = 220 K at 22 GHz Beam filling factor = 0.114 Beam efficiency = 92 %
Spillover Reduction detector output 0 V to 0.3 V el = 90◦ to 0◦ 19 to 26 GHz 19 to 26 GHz
WVR Path Data from 3 mm VLBI, April 2004 210 180 150 120 path length Path length / mm 90 90° 60 elevation Elevation 45° 30 0 0° 18 24 30 36 42 Time / UT hours
VLBI Phase Correction Demo NRAO 150 Pico Veleta - Effelsberg 86 GHz VLBI 2004 April 17 No phase correction VLBI phase WVR phase EB phase correction path 3.4 mm Coherence function before & after EB+PV phase correction ● Path rms reduced 1.0 mm to 0.34 mm ● Coherent SNR rose 2.1 x 420 s
VLBI Phase Correction Demo NRAO 150 Pico Veleta - Effelsberg 86 GHz VLBI 2004 April 17 No phase correction VLBI phase WVR phase EB phase correction path 3.4 mm Coherence function before & after ● Path rms reduced 0.85 mm to 0.57 mm ● Coherent SNR rose 1.7 x 420 s
VLBI Phase Correction Demo NRAO 150 Pico Veleta - Effelsberg 86 GHz VLBI 2004 April 17 Before phase correction at EB VLBI phase WVR phase After phase correction at EB path 3.4 mm Coherence function before & after ● Path rms saturated at 0.95 mm ● Coherent SNR decrease 7.5 x 420 s
VLBI Phase Correction Demo Coherence function after phase correction at EB divided by CF before phase correction NRAO 150 Pico Veleta - Effelsberg 86 GHz VLBI 2004 April 17 2.0 Improvement factor 1.0 0.0 0 s 120 s 240 s 360 s Coherent integration time ● Coherence improves for most scans
Cloud Removal EB WVR path time series Keep VLBI scan times only Subtract linear rate ● Cloud contamination shows up as large scatter in the path lengths NRAO 150 86 GHz VLBI 2004 April 17
Path Length Stability at Effelsberg RMS path fluctuation over 120 s vs hour of day - July RMS path fluctuation over 120 s vs hour of day - December 2 mm 1 mm 0 mm 0 h 24 h 0 h 24 h sunset sunrise UT sunrise sunset UT
Issues: Temperature stability Physical temperature near LNA vs time 20 mK 3 min Tsys vs time 250 mK
Issues: Temperature stability Solution: weaken thermal coupling between Peltier and RF plate Effects: No more 3 min temperature oscillation Worse long-term temperature stability Weak thermal coupling Temperature vs time Strong thermal coupling Temperature vs time 0.7 C 5.5 C 0.75 days 2.5 days
Issues: Noise Diode Stability Tsys vs time on absorber Calibrate using temp. Calibrate using noise diode 2.0 K 22 h Structure function of Tsys on absorber 1 K Original data Calibrated with noise diode Tsys rms / K Calibrated with temperature 0.1 K Time / s 100 1000 10000
Future Developments ● Software development: (Helge Rottmann, RadioNet) data paths into JIVE correlator, AIPS and CLASS improve calibration accuracy (allow for opacity effects) ● Hardware development: temperature stabilization: better insulation, regulation reduce Tsys? Cooling? spillover: reduce with new feed? integration time efficiency: Data acquisition system upgrade beam overlap: move to prime focus receiver boxes?
Conclusions ● WVR running continuously ● Phase correction of 3 mm VLBI has been demonstrated (but in four experiments WVR made things worse.) ● Opacities agree with those from 100 m RT ● Zenith wet delays agree with GPS & radiosonde within 10 mm ● Web-based display & archive access available ●Radiometer stability is 2.7 x 10⁻⁴ in 400 s ● Radiometer sensitivity is 61 mK in 0.025 s integration time http://www.mpifr-bonn.mpg.de/staff/aroy/wvr.html