Download
1 / 28
340 likes | 1.23k Vues
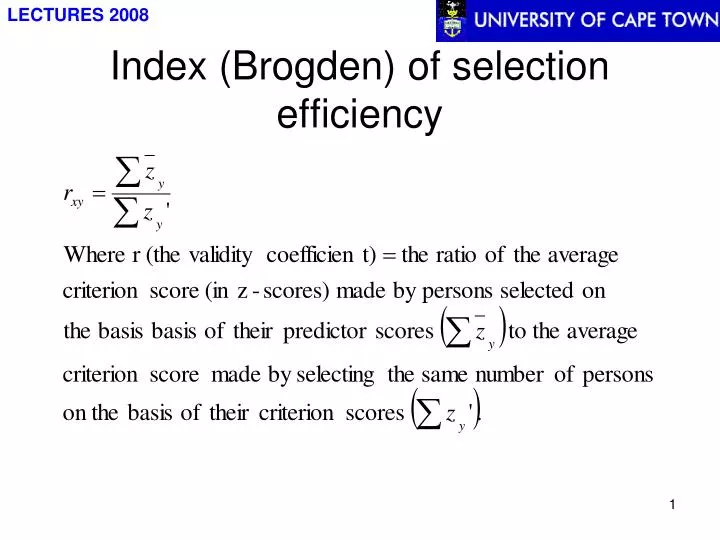
Index (Brogden) of selection efficiency. Index of selection efficiency …. Holds as long as the predictor and criterion are continuous and identical in distribution form The regression of the criterion on the predictor is linear And the selection ratio is held constant.

E N D
Index of selection efficiency … • Holds as long as the predictor and criterion are continuous and identical in distribution form • The regression of the criterion on the predictor is linear • And the selection ratio is held constant
Conclusion of the classical validity approach • General objective: the best selection battery is the one that yields the highest multiple R – selection errors minimised • All emphasis on measurement and prediction • Ignores certain external parameters (e.g. selection ratio, success ratio, base rate) of the situation that largely determines the overall value of the selection instruments
Utility analysis • Utility analysis (decision theory) well suited in business world because costs and expected outcomes are always taken into account. • Provides framework for decision-making by forcing decision maker to define goals clearly, enumerate the expected consequences/possible outcomes of the decisions and to attach different utilities/values to each – decisions can be made on rational basis.
The selection ratio (SR) • Selection ratio (proportion or percentage of applicants to be appointed out of the total who applied for a position) = available job openings/total number of applicants • If high (e.g. .9 or 90%) most applicants selected – unfavourable to organisation – cannot afford to be selective and choose the best candidates • If low (e.g. .2 or 20%) organisation can afford to choose the best performers (“cream of the crop”) • Cut-off score set to appoint required quota or based on the level of job performance deemed minimally acceptable
The base rate (BR) • The proportion of persons employed using current selection procedures (without assessment) and judged successful in the job (the proportion of applicants who eventually would have succeeded if all of them were accepted - Huysamen, 1980) • Changed by adjusting criterion cut-off score (raising or lowering minimum standard on the criterion) • For a measure to be successful, it must result in more correct decisions using it than not • Show incremental validity by improving on the base rate • If the base rate is set very high (e.g. .8) very difficult for any measure to improve on it
Base rate … • Selection measures most successful when BR around .5 – variance of dichotomous variable maximum if pq = .25 (p = successes; q = failures) • The greater the variance (other things being equal), the greater the potential relationship with the predictor • If BR departs radically from .5 in any direction, the benefit of an additional predictor questionable • Situations with different SRs and BRs can result in different predictions and cost-benefit ratios • If significant incremental validity cannot be shown, a predictor should not be added as it cannot improve on selection on base rate
Selection Decision-outcomes Combinations A B Erroneous rejections (false negatives) Correct acceptances Job Performance Criterion (cutoff) Erroneous acceptances (false positives) Correct rejections C D Predictor (cutoff)
Utility assumptions • Classical validity approach trying to maximise multiple-R (minimise erroneous acceptances and rejections) • Does not take utilities of four possible outcomes into consideration • Assumes both kinds of decision errors equally costly • In practice organisations attach different utilities to these outcomes (most organisations not concerned about erroneous rejections, only costs in terms of processing – should also not reject scarce candidates) • Task of decision-makers to be as efficient as possible
Evaluation utilities • Executives demand estimates of expected costs and benefits of personnel programmes • Mostly selection/promotion systems are evaluated solely in correlational terms (i.e. the predictive validity coefficient) • The utility of a selection device is the degree to which its use improves the quality of the individual selected beyond what would have occurred had that device not been used • Quality: (i) the proportion in the selected group who are considered to be “successful”, (ii) the average standard score on the criterion for the selected group or (iii) the Rand payoff to the organisation resulting from the use of a particular selection procedure
The Taylor-Russell utility model • Organisation wishes to add a new predictor to its current selection programme • Utility based on: predictive validity coefficient (r), selection ratio (SR) and base rate (BR) – see tables • Model assumes fixed treatment selection (chosen for specified “treatment”/job) • Ignores rejections • Classifies accepted individuals into successful and unsuccessful groups (all individuals in each group regarded as making equal contributions)
Taylor-Russell model … • Most appropriate where: • Differences in ability beyond the minimum necessary to perform the job do not yield differences in benefit • Placement decisions where individuals are divided into 2/more groups based on their scores on a test battery. All individuals remain in organisation but are treated differently. By assigning particular values to “hits” and “misses” for each possible assignment, cut-off scores can be adjusted to maximise utility. • Differences in output are believed to occur, but are not measurable.
Shortcomings of the Taylor-Russell model • Effectiveness/efficiency of a predictor reflected in terms of success ratio only • Criterion performance described i.t.o. successful/-unsuccessful • When validity fixed, success ratio increases as selection ratio decreases • Success ratio tells us that more/fewer people are successful but not how much • If it is reasonable to assume that the use of higher cut-off scores will lead to better job performance of those selected, the Taylor-Russell tables will underestimate the actual gain to be expected
The Naylor-Shine Model • Assumes a linear relationship between validity and utility: at any given cut-off on the selection measure, the higher the validity, the greater the increase in average criterion score for the selected group over that of the total group (mean criterion score of selectees – mean criterion score of total group) • Defined i.t.o. the increase in average criterion score to be expected form the use of a selection measure with a given validity and selection ratio • Like Taylor-Russell assumes that new predictor will simply be added to the current selection battery • Does not require cut-off on the criterion for minimally acceptable performance
The Naylor-Shine Model … • Answering personnel questions: • Given a specified selection ratio, what will be the average performance level of those selected? • Given a desired selection ratio, what will be the mean criterion score of all cases above predictor cut-off? • Given a desired improvement in the average criterion score of those selected, what selection ratio and/or predictor cut-off value should be used.
The Naylor-Shine Model … • Appropriate when differences in criterion performance not expressed in Rand terms, but it can be assumed that the function relating payoff (performance) to predictor is linear( e.g. in prediction of labour turnover (%) based on scores from a predictor with some validity (e.g. job commitment), then the expected decrease in labour turnover can be assessed as a function of variation in the selection ratio (predictor cut-off score) – if cost accounting procedures are used to quantify labour turnover, savings from reduced turnover can be calculated) • Both models imply that larger differences in the percentage of successful employees or larger increases in average criterion score will yield larger benefits i.t.o savings
The Brogden-Cronbach-Gleser Model • Based on conclusions regarding the effects of the validity coefficient, the selection ratio, the cost of selection, and variability in criterion scores (measured in Rand-value) on utility in fixed treatment selection • Only assumption that relationship between test scores and job performance is direct and linear
Interpretation of the Brogden-Cronbach-Gleser Model • (SDy)(rxy) refers to the slope of the payoff function, relating expected payoff to the assessment score • An increase in validity leads to an increase in slope, but slope also depends on the dispersion of criterion scores
Developments since the 1970s • Alternative methods for estimating SDy • Integrating the selection utility model with capital budgeting models • Assessment of the relative gain\loss in utility resulting from alternative selection strategies
Alternative methods of estimating SDy Restriction on wider use of model determination of SDy : • Schmidt & Hunter ( 1983): The 40% rule – 40% of average salary • As wages and salaries average 57% of the value of goods and services (US economy), this SDy figure is (.4 x .57) => 22.8% or roughly 20% of mean output • If substitute 40% of salary in equation, ΔU is expressed in terms of Rands • If substitute 20 in equation, ΔU is expressed in terms of percentage increase in output • Later shown the figure related to job complexity (15% least complex: clerical – 25% more complex: technicians – 45% most complex: professionals)
Schmidt-Hunter global estimation procedure • If job performance in Rand terms distributed normally, then difference between the value to the organisation of goods and services produced by the average employee and those produced by an employee at the 85th percentile in performance = SDy (1SD above the mean) • To facilitate: raters told to imagine how much goods and services will cost if outsourced • SDy inferred from the difference between these two estimates
Cascio-Ramos procedure Based on traditional job analysis/evaluation and performance appraisals • Identification and rating of each job i.t.o. dimensions such as time/frequency and importance • Rating each employee i.t.o. the principal activities identified • Development of an overall percentage weight for each principal activity bases on the results of step 1 • Development of the Rand value of each principal activity by multiplying its percentage weight by average annual salary of all individual in the study • Overall worth of all employees: summing products of Rand values of each principal activity x performance rating on that activity • Computing SDy
Integration of selection utility with capital budgeting models • Selection utility models similar to capital budgeting models • Projected stream of future returns is estimated and the relevant costs subtracted to yield expected net returns • Utility = returns – costs. • While HR considers the net Rand returns form a selection process to represent the end product of the evaluation process, capital budgeting theory considers forecasting of Rand benefits and costs as the first step in estimating a project’s utility • Implies a high net return on a selection programme may not produce maximum benefits from the organisation’s perspective (increase in market value)
Capital budgeting … • 3 limitations of the model: • Does not take time value (discount rate) into account • Ignores the concept of risk • Ignores the impact of taxation on payoffs – any incremental income generated as a result of the selection programme may be taxable • Nevertheless lesson to be learned: more advantageous and realistic to consider a cash outlay for a human resource intervention as a long term investment and not just as a short term operating cost. • Examples of successes
Assignment 4 • Assess the utility and costs of different assessment options and make recommendations to management regarding strategic HR decisions (Specific questions on website). Weight: 40% (Hand in: 6 October)