Download
1 / 38
380 likes | 515 Vues
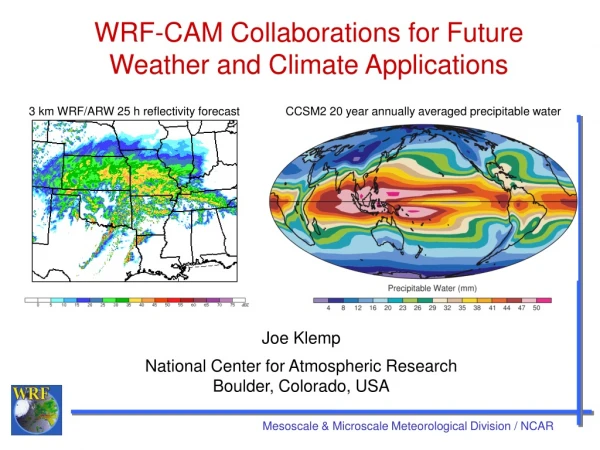
Insights from global analyses into vertical temperature changes. Kevin E Trenberth National Center for Atmospheric Research Boulder CO. Why should we expect surface temperatures to be related to those aloft?. 16 14 12 10 8 6 4 2 0. DALR MSU2. Ozone layer Stratosphere

E N D
Insights from global analyses into vertical temperature changes Kevin E Trenberth National Center for Atmospheric Research Boulder CO
Why should we expect surface temperatures to be related to those aloft?
16 14 12 10 8 6 4 2 0 DALR MSU2 Ozone layer Stratosphere Tropopause Troposphere Surface temperature Sharp discontinuities are NOT resolved by satellite IR and Microwave radiances that cover broad layers km -80 -60 -40 -20 0 20 40 Temperature C Trade wind inversion which isolates troposphere from surface.
Key issues • Where on Earth is there a good local connection between temperatures at the surface and in the troposphere- nowhere is there a local heat balance? • The links are non local: • Regions of subsidence (inversions) have complete disconnect • In regions of convection: low level convergence, moisture convergence, upper level divergence: vertical profile depends on moisture (from afar) and latent heating • Local heating is NOT manifested in temperature rise but instead causes vertical motions, adiabatic cooling, and warming in the subsidence branch • Where subsidence occurs is determined by available cooling (mostly dynamical)
Evaporation Moisture transport Moisture transport Hadley circulation and heat budget in subtropics Radiation solar down infrared up Latent heating in convective rain Dynamical warming by subsidence Dynamical cooling by advection Heat transport by transients warm Ocean heat transport Trenberth and Stepaniak 2003, J Climate
Key issues The use of global means averages over many regions and many processes and is not very useful for resolving perceived discrepancies. Recommendation: focus on regions and physically-based expectations
Correlation of surface with MSU-2 locally for monthly anomalies Updated from Hurrell and Trenberth 1996
Correlation of monthly anomalies with global mean temperature Updated from Hurrell and Trenberth 1996
Regression of monthly anomalies with global mean temperature
Key issues The use of linear trends is always inappropriate. They depend critically on end points and are not robust to small changes in length of record. Nor are they a reasonable null hypothesis for climate change. Recommendation: Focus on robust time filters
18 pentad overlap NOAA-9 to NOAA-10 MSU-2 pentad Temperatures from Vinnikov and Grody (2003) Top: trend and total Bottom: detrended anomalies
Temp anomalies 10N-10S Comparison of miscellaneous products: Puzzling changes at 100 mb in late 2000 in METO and NCEP reanalyses /CDAS: In UKMO: Change in assimilation system Nov 2000 In NCEP??? TOVS ceased and ATOVS NOAA-16 started 27 Feb 2001??? Bill Randel 2003
As well as puzzling changes at 100 mb in late 2000 in reanalyses /CDAS there are weird values at 850 mb: Too warm in 2002 Subtropical trade-wind inversion??? Bill Randel 2003
Evidence of spurious diurnal cycle in sonde before mid 1980s?
CRU/Hadley Centre http:///www.cru.uea.ac.uk/cru/info/warming Trends and interannual variability ERA-40
1958-1968 1969-1979 1980-1990 1991-2001 Trends and interannual variability Anomalies in 2m temperature and 500hPa height oC
Trends and interannual variability Global-mean ERA-40 500hPa temperature Time series of MSU-2 brightness-temperature anomaly (K), from Wentz and colleagues Courtesy Adrian Simmons Image produced by Remote Sensing Systems and sponsored by NOAA Climate and Global Change Program
Northern hemisphere extratropics Trends and interannual variability Tropics Mean ERA-40 500hPa temperature Southern hemisphere extratropics
No sonde bias correction before 1979 VTPR bias correction problem Cold bias around southern winter pole in early years Parker & Alexander (2002) Global-mean ERA-40 70hPa temperature Trends and interannual variability
ERA-40 T Trends 1979-2001; 1958-2001 • 1000 700 500 • Global • NH • Tropics • SH • 300 200 100 • Global • NH • Tropics • SH Courtesy Adrian Simmons
Linear T trends ERA40 1979-2001 level Globe NH Tr SH 1000 0.3 0.7 0.2 0.2 925 0.3 0.7 0.3 0.2 850 0.4 0.7 0.4 0.3 775 0.4 0.6 0.2 0.3 700 0.2 0.5-0.2 0.3 600 0.1 0.4 -0.3 0.3 500 0.1 0.4 -0.3 0.3 400 0.2 0.4 -0.30.5 300 0.50.6 0.2 0.7 250 0.5 0.3 0.7 0.4 200 0.3 0.0 1.3-0.3 150 0.2 0.1 1.1-0.8 100 0.1 -0.20.7-0.3 70 -0.6 -0.9 -0.7 -0.3 50 -1.5 -1.5 -1.4 -1.7
MSU Version b Hurrell and Trenberth 1998
Findings: • Linear trends are bad! • Vertical structures are complex and cannot be resolved by broad layers • Temperature trends differ with level and time interval • Local and regional differences are large; • Global means are not useful: for resolving processes or differences • Different processes are important at different levels • Surface: heat capacity; land vs ocean • Stratosphere: ozone depletion • Troposphere: convection, subsidence, advection • Radiation: water vapor, cloud, aerosols, ozone, etc
QUESTIONS: Given that global mean surface temperature anomalies are dominated by continental land areas in the NH, while global “satellite temperature” anomalies are dominated by the Tropical regions, why should we expect a relationship at all? • How do the surface vs boundary layer vs troposphere temperatures covary regionally? • What are the differences and similarities regionally: land vs ocean, tropics vs subtropics vs extratropics? • Why are there regions (e.g., the subtropics) where the surface and mid-troposphere monthly mean temperature anomalies are negatively correlated?
QUESTIONS: • What are the characteristics of the trade wind inversion in terms of its level and intensity and how it varies, and how is that manifested in the satellite record and in models? • What are the characteristics of wintertime surface inversions over mid- latitude continents (that provide a disconnect between the surface and the troposphere)? • What are the characteristics of the tropopause with annual cycle, ENSO, volcanoes, and climate change? Variations of 1 km in altitude can not be captured by the coarse resolution of the analysis or in models. • What can be said about the transition of warming near the surface to cooling in the stratosphere with climate change? • What is the diurnal cycle of temperature throughout the atmosphere and how does it alias onto satellite records that drift in local equator crossing time (LECT)? • Can we reconcile warmings found in tropical glaciers at about 500 to 600 mb with the tropospheric temperature record?
Is the vertical temperature profile different in regions with absorbing aerosols, and how much of that is because of no rain (allowing the aerosols to be present) vs the aerosol effects? • What is the role of moisture and cloud changes? • What is the moisture budget in three dimensions and as a function of time? • What is the heat budget in three dimensions and as a function of time? • How are the atmospheric forcings changing? How well are these known? • How and why are CO2 concentrations in the atmosphere changing? • How do changes in ozone amounts alter the vertical profile of temperatures? • How much net heat is going into the oceans and how much is being redistributed and released at different places and different times, such as during El Niño events? • Urban heat island effects are real climate changes but limited in areal extent. How do they affect the temperature record? • Is the observational and analysis record adequate to address the above questions? • How well do climate models reproduce the local and global relationships between the surface and troposphere? • Can climate models be used for attribution of changes to forcings and processes?