Download

1 / 81
950 likes | 1.67k Vues
Chapter 6 Mechanical Behavior. Among the major three materials, metal is the most important, abundant, and useful engineering material for every day human life. Steel is one of the good examples of the structural materials.

E N D
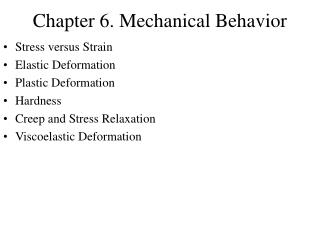
Amongthe major three materials, metal is the most important, abundant, and useful engineering material for every day human life. Steel is one of the good examples of the structural materials. In this chapter, basic concepts of the major mechanical properties of metals are discussed ; 1). Stress verses Strain (elastic and plastic deformation) 2). Hardness 3). Creep and Stress Relaxation 4). Viscoelastic Deformation The concepts of the mechanical properties and the idea for the testing methods are also applied for ceramics and polymer materials, even though the there may be some differences for different materials..
6.1 Stress verses Strain ①. METALS Load data to computer Tochoose good structural materials, the designer engineers want to know; 1). How strong is it? 2). How much deformation takes place under a certain given load? Figure 6.1Tensile test. Strain gage computer These properties are obtained by the tensile testing with the testing machine shown in Figure 6.1. Explain the use of the machine.
The load necessary to produce a given elongation is monitored as the specimen is pulled in tension at a constant rate. Load data from the load cell and elongation data from the strain gage are combined to draw Load-Elongation curve. Figure 6.2Load-versus-elongation curve obtained in a tensile test. The specimen was aluminum 2024-T81. Nowadays, all the data are treated by computer to draw stress-strain curve. (To be discussed later.)
Load-Elongation data are converted to Stress-Strain data to be drawn σ-εcurve. In this plot, σ means “Engineering Stress” ε means “Engineering strain”. P σ= Figure 6.3Stress-versus-strain curve obtained by normalizing the data of Figure 6.2 for specimen geometry. A0 ℓ – ℓ0 ∆ℓ ε= = ℓ0 ℓ0 Explain the meanings of these two.
It is not technologically easy to distinguish the border line between elastic and plastic deformation range. (o.2% off set Y.S.) Figure 6.4The yield strength is defined relative to the intersection of the stress–strain curve with a “0.2% offset.” Yield strength is a convenient indication of the onset of plastic deformation. Therefore, o.2% off set Y.S. is used. Elastic strain is linear, but plastic strain is not linear. Plastic strain is permanent deformation, not recovered. Elastic strain Plastic strain
Strain hardening is taking place during plastic deformation Figure 6.5Elastic recovery occurs when stress is removed from a specimen that has already undergone plastic deformation. σ E = ε Hook’s law unloading Net plastic strain 0.002
Necking begins at UTS to reduce the load. Necking → cross sectional area ↓ ①.Modulus of elasticity, E ②. 0.2% off set yield strength ③. Ultimate tensile strength ④. Ductility (εfailure x 100) ⑤.Toughness (area under the σ-ε curve) Figure 6.6The key mechanical properties obtained from a tensile test: 1, modulus of elasticity, E; 2, yield strength, Y.S.; 3, tensile strength, T.S.; 4, ductility, 100 × failure(note that elastic recovery occurs after fracture); and 5, toughness = ∫σd(measured under load; hence, the dashed line is vertical).
1). Load reducing factor : Over the UTS, local deformation begins and necking is occurring. Because this reduced cross sectional area, the load need to pull the specimen is decreased. This is the reason why the load or engineering stress is reduced after the UTS. Figure 6.7Neck down of a tensile test specimen within its gage length after extension beyond the tensile strength. (Courtesy of R. S. Wortman.) 2). Load increasing factor : During plastic deformation, strain hardening is occurring to increase the load need to pull the specimen, therefore, the load is increasing through out the plastic deformation. These two factors are competing to have the stabilized final load.
True stress-true strain ; load(p) 1). True stress: σtr= Aactural Figure 6.8True stress (load divided by actual area in the necked-down region) continues to rise to the point of fracture, in contrast to the behavior of engineering stress. (From R. A. Flinn and P. K. Trojan, Engineering Materials and Their Applications, 2nd ed., Houghton Mifflin Company, 1981, used by permission.) ℓf ∆ℓ ℓf 2). True strain: ε=∫ = ln ℓ0 ℓ0 ℓ0 From YS up to UTS, plastic deformation is uniform throughout the gage length and true stress-strain plot is expressed as eqn. (6.4). σT = KεT n (6.4) ln σT =K’+n lnεT → ln σT vs lnεTplot gives a strait line with the exponent of n and the intercept value of K’ ,(or lnK). K and n values are constants with different values for different metals.(n=strain-hardening exponent )
Toughness : The area underneath the σ-εcurve, or, the energy observed by the specimen until it fractures. Figure 6.9The toughness of an alloy depends on a combination of strength and ductility. Ductility : The measure of the ability to deform it fails and expressed in terms of % elongation at failure, (=100xεfail) A less-used definition is the % reduction in area[=(Ao-Afin)/Ao] High strength, High ductility, High toughness
For low-carbon steel used to form complex shapes, the values of nwill normally be approximately0.22. Higher values, up to 0.26, indicate an improved ability to be deformed during the shaping process without fracture of the piece. The value of Kindicates that how strong the material is, i.e., the larger the value, the stronger the material.
Figure 6.10For a low-carbon steel, the stress-versus-strain curve includes both an upper and lower yield point. To begin yielding, it takes higher stress to break up the dislocation locking by segregated carbon atoms, however, once yielding has started, stress for the continues deformation needs lower stress because dislocations are free from the segregated carbon atoms. After the lower yield point, due to the strain hardening the stress is gradually increased.
Figure 6.11The Poisson’s ratio (ν) characterizes the contraction perpendicular to the extension caused by a tensile stress.
Figure 6.12Elastic deformation under a shear load. Shear stress(τ) : The load on the sample(Ps) / sample area(As) parallel to the load, τ=Ps /As This shear stress(could be one of the stress components of the tensile stress) is the stress which moves dislocation for deformation. Shear strain(γ) : An angular displacement(α) by the applied shear stress, γ= tan α. Shear modulus(or Modulus of rigidity) : G= τ/ γ. E = 2G(1+ν)
Examples and Practice Problems : Students are asked to review the “Example” of 6.1 ~ 6.3 and solve the “Practice Problem” of 6.1 ~ 6.3 in the text.
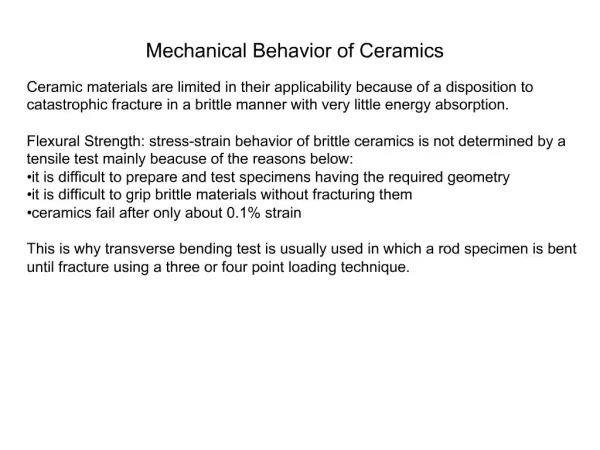
②. CERAMICS AND GLASSES Many of the mechanical properties discussed for metals are equally important to ceramics or glasses used in structural applications. In addition, the different nature of these non-metals leads to some unique mechanical testing methods for the different behaviors. Ceramics and glasses are not so ductile and have very limited amount of plastic deformation (practically no plasticity). Because of this characteristic behavior of these brittle materials, when they are pulled in tension, failure occurs in the elastic region. → Brittle fracture. Therefore, compressive testing is preferred rather than tensile test. See next figures.
Ceramics are very weak under tensile load because of crack initiation at the internal defects. Figure 6.13The brittle nature of fracture in ceramics is illustrated by these stress–strain curves, which show only linear, elastic behavior. In (a), fracture occurs at a tensile stress of 280 MPa. In (b) a compressive strength of 2,100 MPa is observed. The sample in both tests is a dense, polycrystalline Al2O3. The strength parameter of this brittle ceramics is the modulus of rupture(MOR) Which is sometimes referred to as the flexural strength, similar magnitude to the T.S. 3FL MOR = (F=applied force, b=width, h=thickness. See fig 6.14) 2bh2
This three point bending test, designed for the test of brittle materials, is more effective than the traditional tensile test for metals. Max. comp. Figure 6.14The bending test that generates a modulus of rupture. This strength parameter is similar in magnitude to a tensile strength. Fracture occurs along the outermost sample edge, which is under a tensile load. Max. tensile Tensile stress intensity is the highest at the opposite point of the applied force where the fracture occurs. The tensile stress effect is minimum in this test. Therefore, more reliable than normal tensile test. (Unitofstress)
In the previous section, νvalues of metals were typically about ⅓, here it is shown that νvalues of ceramics are about ¼.
Griffith model is designed for purely brittle material. At the crack tip, the stress is concentrated (σm) to be raised higher than the applied stress (σ). Figure 6.15Stress (σm) at the tip of a Griffith crack. (c/ρ)2 σm≒ 2σ (Ρis the radius of crack tip.) This equation indicates that; ρgets smaller (or crack tip becomes sharper ), and so the concentrated stress at the crack tip become much larger. When σm reaches the fracture stress, the crack grows unstably.
Examples and Practice Problems : Students are asked to review the “Example” of 6.4 and solve the “Practice Problem” of 6.4 in the text.
③. POLYMERS As long as the strength is concerned, polymers have the lowest strength compared to metals and ceramics. Polymers are becoming the substitution of metals. → need to verify mechanical properties. Because of their weak tensile strength and modulus, flexural strength and flexural modulus are more frequently needed. Flexural modulus, or modulus of elasticity in bending is similar to that already introduced for ceramics. L3m m is the slope of the tangent to the initial strait-line portion of the load-deflection curve and all other terms are same as those in Eq.(6.10) Eflex = 4bh3 An important advantage of the flexural modulus for polymer is that it describes the combined effects of compressive deformation (adjacent to the point of applied load) and tensile deformation (on the opposite side of the specimen). (See fig. 6.14)
This stress-strain curves are much similar to those of metals, however, polymers are very weak and more sensitive to the test temperature, compared to metals. Figure 6.16Stress-versus-strain curves for a polyester engineering polymer. (From Design Handbook for Du Pont Engineering Plastics, used by permission.) Most of the polymers are not sensitive to humidity in measuring the mechanical properties. But, nylon is the exception.
Effect of humidity : + E and UTS are influenced. Figure 6.17Stress-versus-strain curves for a nylon 66 at 23ºC showing the effect of relative humidity. (From DesignHandbook for Du Pont Engineering Plastics, used by permission.) 0 _
Examples and Practice Problems : Students are asked to review the “Example” of 6.5 and 6.6 and solve the “Practice Problem” of 6.5 and 6.6 in the text.
6.2 Elastic Deformation The fractional deformation of material in the initial elastic region is as small as the atomic scale, it is dealt only with the dotted red line of the “F-a” curve in the immediate vicinity of the equilibrium atom separation distance. Figure 6.18Relationship of elastic deformation to the stretching of atomic bonds. According to the above mentioned concept, the “L-E” or “σ-ε”curves are considered to be straight. Therefore, elastic stress and strain are said to be linearly proportional.
Examples and Practice Problems : Students are asked to review the “Example” of 6.7 and solve the “Practice Problem” of 6.7 in the text.
6.3 Plastic Deformation The fundamental mechanism of plastic deformation is the distortion and reformation of atomic bonds. We know that diffusion needs “vacancy”. Plastic deformation of crystalline materials also needs “dislocation”.
Frenkel’s calculation of the theoretical critical shear stress to move as in the Fig. 6.19 is roughly one order of magnitude less than the bulk shear modulus, G, for the material. Figure 6.19Sliding of one plane of atoms past an adjacent one. This high-stress process is necessary to plastically (permanently) deform a perfect crystal. Slip plane > 1,000MPa. For Cu, G ~ However, actual stress needs to deform Cu is less than 100 MPa. The discrepancy between the theoretical and practical stress is explained by the introduction of the concept of dislocation. In Sec. 4.3, we already have learned the dislocation as the line defect; 1). Edge, 2). Screw and 3). Mixed dislocations.
Figure 6.20A low-stress alternative for plastically deforming a crystal involves the motion of a dislocation along a slip plane. Explain !
Motion of mixed dislocation; Figure 6.21Schematic illustration of the motion of a dislocation under the influence of a shear stress. The net effect is an increment of plastic (permanent) deformation. (Compare Figure 6.21a with Figure 4.13.)
Figure 6.22Goldie the caterpillar illustrates (a) how difficult it is to move along the ground without (b) a “dislocation” mechanism. (From W. C. Moss, Ph.D. thesis, University of California, Davis, CA, 1979.)
:same as the Burger’s vector Figure 6.23Dislocation slip is more difficult along (a) a low-atomicdensity plane than along (b) a high-atomic-density plane. The shorter the BV, the easier the slip. The shortest BV is one atomic distance.
12 systems Figure 6.24Slip systems for (a) fcc aluminum and (b) hcp magnesium. 3 systems
{211} 〈111〉 6 x 2 = 12 {321} 〈111〉 12 x2 = 24 Total 48
Dislocations generated by the cold working. These many dislocations in different slip systems interact each other to retard the movement of the dislocations. → “work hardening” Figure 6.25Forest of dislocations in a stainless steel as seen by a transmission electron microscope [Courtesy of Chuck Echer, Lawrence Berkeley National Laboratory, National Center for Electron Microscopy.]
Higher stress region Figure 6.26How an impurity atom generates a strain field in a crystal lattice, thereby causing an obstacle to dislocation motion. The dislocation is now blocked by the impurity (or solute) along the slip plane and becomes difficult to move.→ “solution hardening”.
F = applied force, A=cross-sectional area of sample, As =cross-sectional area of slip plane. Figure 6.27Definition of the resolved shear stress, τ , which directly produces plastic deformation (by a shearing action) as a result of the external application of a simple tensile stress, σ. σ= F/A, Fcos λ: The component of F operating in the slip direction, As = A/cosφ: area of the slip plane. Since τ=(Fcos λ)/ As ∴τ= (Fcos λ)/(A/cosφ) = σcos λ cosφ This is called “resolved shear stress”. As Among the “resolved shear stress” there will be one “stress” which can create plastic deformation, and we call this “Critical Resolved Shear Stress, τc, (CRSS)”.
Examples and Practice Problems : Students are asked to review the “Example” of 6.8 and solve the “Practice Problem” of 6.8 in the text.
6.4 Hardness The hardness test is a relatively simple alternative to the tensile test of fig. 6.1. The resistance of materials to indentation is a qualitative indication of strength. Figure 6.28Hardness test. The analysis of indentation geometry is summarized in Table 6.9. The indenter can be either rounded or pointed and is made of a material much harder than the test piece; steel, tungsten carbide, or diamond are used. Experimentally measured hardness numbers are calculated from appropriate formulas using the indentation geometry measurements. Microhardness measurements are made using a high-power microscope. See Table 6.9 for some hardness testing methods.
For wide area of bulk property For narrow area or small particle For ferrous metals For non-ferrous metals Rockwell is the most useful & easy method measuring many different materials.
Grade; TS-YS-%Elong. Fits better with TS than YS ? Figure 6.29(a) Plot of data from Table 6.10. A general trend of BHN with T.S. is shown. (b) A more precise correlation of BHN with T.S. (or Y.S.) is obtained for given families of alloys. [Part (b) from Metals Handbook, 9th ed., Vol. 1, American Society for Metals, Metals Park, OH, 1978.] BHN ∝ tensile strength. (not only BHN but other hardness numbers also proportional to tensile strength.) (explain the use of hardness measured values)