Download

1 / 19
190 likes | 362 Vues
Using Arbitrage Pricing Theory To Analyse UK and USA Property Cycle Differences. European Real Estate Society Stockholm, Sweden June 2009 Terry V. Grissom Ph.D.* Jasmine L.C. Lim Ph.D.* James L. DeLisle Ph.D.** *School of the Built Environment University of Ulster, Jordanstown

E N D
Using Arbitrage Pricing Theory To Analyse UK and USA Property Cycle Differences European Real Estate Society Stockholm, Sweden June 2009 Terry V. Grissom Ph.D.* Jasmine L.C. Lim Ph.D.* James L. DeLisle Ph.D.** *School of the Built Environment University of Ulster, Jordanstown **College of Built Environments University of Washington, Seattle
Investor concerns seeking potential timing market turnaround • An Expectation is that an upturn in USA property/investment market will proceed an upturn in the UK: correlation analysis supports this position • However analysis of historic property and economic cycles differences suggests alternative scenarios • Expectation is not supported by lead-lag analysis
Exhibit 2: Correlation of Property Returns in the UK and US and Systematic Factors
C o m p a r i s o n o f U K a n d U S A G D P P e r c e n t a g e C h a n g e a n d T r e n d s .06 U K G D P % .04 U K T r e n d .02 U S A G D P % U S A T r e n d .00 9 - 1 1 -.02 -.04 -.06 1980 1985 1990 1995 2000 2005 2010
The differences in pricing/performance of cross markets in time suggest the arbitrage potential that may not support an equilibrium clearance of differences. • This suggest a limited integration and possible segmentation of the two property/equity markets associated with divergent regimes due to differences in economic fluctuations. • This suggests the use of an APT macroeconomic variable model to address differences in the cyclical patterns observed. • The DCF construct of the APT model suggest pricing differences associated with behavioural differences observed in the two markets.
One test of a behavioural pricing differences is noted by Hendershott and MacGreger (2005) • They note that investment behaviour difference between UK and USA property markets based on mean/trend reversion behaviour. Where: • UK is rational reflecting trend reversion pricing • USA is non-rational with no trend reversion pricing noted
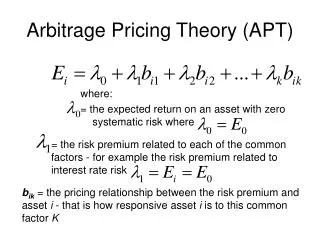
The implication that differences in investor behaviour may contribute to pricing and timing differences defining the two markets fits the construct of the MVM Arbitrage Price Models • This achieved using a spline analytic for cycle regime delineation as employed by Grissom & DeLisle (1999). This variable assist in identifying the potential timing and turnarounds observed and expected for both the UK and USA property markets. • The theoretical constructs and the procedural steps employed in this analysis is illustrated in the following set of equations
APT (UK) with Expected risk free rate and US Property Performance R2 = 65.66 Intercept & Beta t statistic APT (UK) with Expected Zero Beta reflecting US Property Performance R2 = 65.66 0.022861 + -0.199716() - 1.101734(U) + 0.021012() + 0.029849() +0.244874Rit|US 1.897037 -0.652772 -4.355030 0.164764 0.564750 2.099157 Intercept & Beta t statistic (0.070599) -0.199716() - 1.101734(U) + 0.021012() + 0.029849() +0.244874Rit|US 1.897037 -0.652772 - 4.355030 0.164764 0.564750 2.099157
KnotE(Rit|) coefficient Recessionary Spline t-Statistic R2 -value UK 1988-91 2.0958 5.5915 97.95 0.0000 1994-95 -19.1563 -1.6583 88.91 0.1358 1998-99 2.3055 1.1847 40.31 0.2738 2001-02 0.9952 31.8677 98.70 0.0000 2007-09 3.7072 1.2936 51.83 0.9465 US 1990-91 1.4878 5.6030 86.07 0.0000 2001-02 3.6434 6.0746 80.45 0.0000 2007-09 0.3499 1.1229 75.62 0.2818
Conclusions • The UK Property investment market is at best is only moderately integrated with the US property and capital markets suggesting the potential for similar pricing activities. • However cycle investigation shows a difference in lead lag associations across markets. • This suggest the possibility of arbitrage across markets and time. • The application of the APT model shows that an integration of the US property returns and general economic factors however reduce the explanatory effect of MVM factors.
Conclusions • This suggested a difference in pricing behaviour across the 2 markets. • One previously hypothesized reason is that the two markets reflect pricing differentials as a function of mean/trend reversion behaviour, suggesting that the UK more rationally prices general economic variables, while the US shows a decoupling of financial and real economic variables in the estimation of property returns