Download
1 / 37
370 likes | 537 Vues
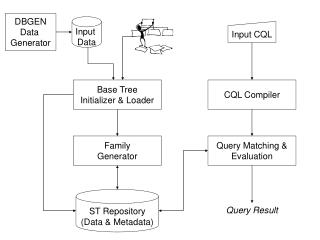
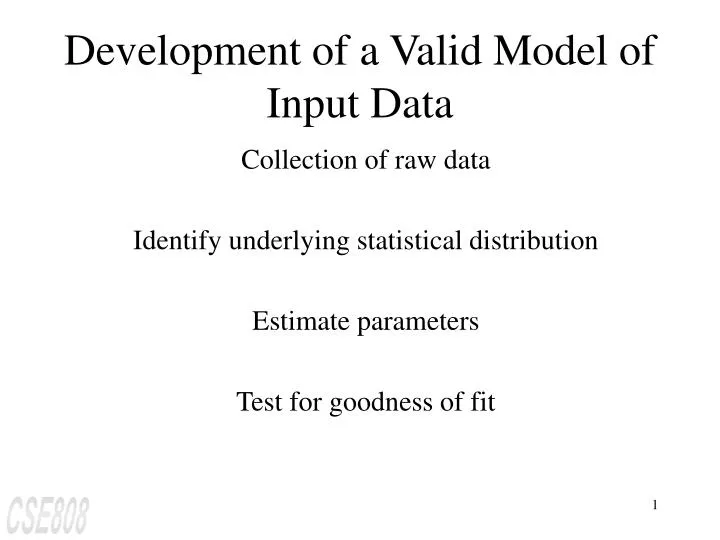
Development of a Valid Model of Input Data. Collection of raw data Identify underlying statistical distribution Estimate parameters Test for goodness of fit. Identifying the Distribution. Histograms Notes: Histograms may infer a known pdf or pmf.

E N D
Development of a Valid Model of Input Data Collection of raw data Identify underlying statistical distribution Estimate parameters Test for goodness of fit
Identifying the Distribution • Histograms Notes: Histograms may infer a known pdf or pmf. Example: Exponential, Normal, and Poisson distributions are frequently encountered, and less difficult to analyze. • Probability plotting (good for small samples)
Coarse, ragged, and appropriate histogram (Figure 1) (1) Original Data - Too ragged Sample Histograms
Coarse, ragged, and appropriate histogram (Figure 1) (2) Combining adjacent cells - too coarse Sample Histograms (cont.)
Coarse, ragged, and appropriate histogram (Figure 1) (3) Combining adjacent cells - appropriate Sample Histograms (cont.)
Discrete Data Example The number of vehicles arriving at the northwest corner of an intersection in a 5-minute period between 7:00 a.m. and 7:05 a.m. was monitored for five workdays over a 20-week period. Following table shows the resulting data. The first entry in the table indicates that there were 12 5-minute periods during which zero vehicles arrived, 10 periods during which one vehicle arrived, and so on.
Discrete Data Example (cont.) Arrivals Arrivals per Period Frequency per Period Frequency 0 12 6 7 1 10 7 5 2 19 8 5 3 17 9 3 4 10 10 3 5 8 11 1 Since the number of automobiles is a discrete variable, and since there are ample data, the histogram can have a cell for each possible value in the range of data. The resulting histogram is shown in Figure 2
(Figure 2) Number of arrivals per period Histogram of number of arrivals per period
Continuous Data Example Life tests were performed on a random sample of 50 PDP-11 electronic chips at 1.5 times the normal voltage, and their lifetime (or time to failure) in days was recorded: 79.919 3.081 0.062 1.961 5.845 3.027 6.505 0.021 0.012 0.123 6.769 59.899 1.192 34.760 5.009 18.387 0.141 43.565 24.420 0.433 144.695 2.663 17.967 0.091 9.003 0.941 0.878 3.371 2.157 7.579 0.624 5.380 3.148 7.078 23.960 0.590 1.928 0.300 0.002 0.543 7.004 31.764 1.005 1.147 0.219 3.217 14.382 1.008 2.336 4.562
Continuous Data Example (cont.) Chip Life (Days) Frequency Chip Life (Days) Frequency 0 £ xi < 3 23 30 £ xi < 33 1 3 £ xi < 6 10 33 £ xi < 36 1 6 £ xi < 9 5 .......... ..... 9 £ xi < 12 1 42 £ xi < 45 1 12 £ xi < 15 1 .......... ..... 15 £ xi < 18 2 57 £ xi < 60 1 18 £ xi < 21 0 .......... ..... 21 £ xi < 24 1 78 £ xi < 81 1 24 £ xi < 27 1 .......... ..... 27 £ xi < 30 0 143 £ xi < 147 1 Electronic Chip Data
(Figure 3) Histogram of chip life Continuous Data Example (cont.)
The sample mean, X, is defined by • --- (Eq 1) • And the sample variance, S2, is defined by • --- (Eq 2) Parameter Estimation
If the data are discrete and grouped in a frequency distribution, Eq1 and Eq2 can be modified to provide for much greater computational efficiency. The sample mean can be computed by --- (Eq 3) And the sample variance, S2, is defined by --- (Eq 4) Parameter Estimation (cont.)
Suggested Estimators for distr. often used in Simulation Distribution Parameter(s) Suggested Estimator(s) Poisson a a = X Exponential l l = 1 / X Gamma b, q b = see(Table A.8) q = 1 / X Uniform b b = {(n + 1) / n } × [max(X)] on (0, b) (unbiased) Normal m, s2 m = X s2 = S2 (unbiased)
Distribution Parameter(s) Suggested Estimator(s) Weibull a, b b0 = X / S with v = 0 bj = bj-1 - f(bj-1) / f ‘(bj-1) Iterate until convergence a = {(1/n) × } 1/b Suggested Estimators for distr. often used in Simulation
Goodness-of-Fit Tests The Kolmogorov-Smirnov test and the chi-square test were introduced. These two tests are applied in this section to hypotheses about distributional forms of input data.
This test is valid for large sample sizes, for both discrete and continuous distributional assumptions when parameters are estimated by maximum likelyhood. The test procedure begins by arranging the n observations into a set of k class intervals or cells. The test statistic is given by --- (Eq 5) where Oi is the observed frequency in the ith class interval and Ei is the expected frequency in that class interval. Goodness-of-Fit TestsChi-Square Test
The hypotheses are: H0: the random variable, X, conforms to the distributional assumption with the parameter(s) given by the parameter estimate(s) H1: the random variable, X, does not conform The critical value is found in Table A.6. The null hypothesis, H0, is rejected if Goodness-of-Fit TestsChi-Square Test (cont.)
Goodness-of-Fit TestsChi-Square Test (cont.) (Table 1) Recommendations for number of class intervals for continuous data Sample Size, Number of Class Intervals, n k 20 Do not use the chi-square test 50 5 to 10 100 10 to 20 >100 Ön to n/5
Goodness-of-Fit TestsChi-Square Test (cont.) (Example:) (Chi-square test applied to Poisson Assumption) In the previous example, the vehicle arrival data were analyzed. Since the histogram of the data, shown in Figure 2, appeared to follow a Poisson distribution, the parameter, a = 3.64, was determined. Thus, the following hypotheses are formed: H0: the random variable is Poisson distributed H1: the random variable is not Poisson distributed
Goodness-of-Fit TestsChi-Square Test (cont.) The pmf for the Poisson distribution was given: ì(e-a ax) / x! , x = 0, 1, 2 ... p(x) = í (Eq 6) î0 , otherwise For a = 3.64, the probabilities associated with various values of x are obtained using equation 6 with the following results. p(0) = 0.026 p(3) = 0.211 p(6) = 0.085 p(9) = 0.008 p(1) = 0.096 p(4) = 0.192 p(7) = 0.044 p(10) = 0.003 p(2) = 0.174 p(5) = 0.140 p(8) = 0.020 p(11) = 0.001
Goodness-of-Fit TestsChi-Square Test (cont.) Observed Frequency, Expected Frequency, (Oi - Ei)2 / Ei xi Oi Ei 0 12 2.6 7.87 1 10 22 9.6 12.2 2 19 17.4 0.15 3 17 21.1 0.80 4 10 19.2 4.41 5 8 14.0 2.57 6 7 8.5 0.26 7 5 4.4 8 5 2.0 9 3 17 0.8 7.6 11.62 10 3 0.3 11 1 0.1 100 100.0 27.68 (Table 2) Chi-square goodness-of fit test for example
Goodness-of-Fit TestsChi-Square Test (cont.) With this results of the probabilities, Table 2 is constructed. The value of E1 is given by np1 = 100 (0.026) = 2.6. In a similar manner, the remaining Ei values are determined. Since E1 = 2.6 < 5, E1 and E2 are combined. In that case O1 and O2 are also combined and k is reduced by one. The last five class intervals are also combined for the same reason and k is further reduced by four.
The calculated is 27.68. The degrees of freedom for the tabulated value of c2 is k-s-1 = 7-1-1 = 5. Here, s = 1, since one parameter was estimated from the data. At a = 0.05, the critical value is 11.1. Thus, H0 would be rejected at level of significance 0.05. The analyst must now search for a better-fitting model or use the empirical distribution of the data. Goodness-of-Fit TestsChi-Square Test (cont.)
Chi-Square Test withEqual Probabilities Continuous distributional assumption ==> Class intervals equal in probability Pi = 1 / k since Ei = nPi³ 5 ==> n / k ³ 5 (substitution) and solve for k yields k £n / 5
Chi-Square Test forExponential Distribution (Example) Since the histogram of the data, shown in Figure3 (histogram of chip life), appeared to follow an exponential distribution, the parameter l = 1/X = 0.084 was determined. Thus, the following hypotheses are formed: H0: the random variable is exponentially distributed H1: the random variable is not exponentially distributed
Chi-Square Test forExponential Distribution (cont.) In order to perform the chi-square test with intervals of equal probability, the endpoints of the class intervals must be determined. The number of intervals should be less than or equal to n/5. Here, n=50, so that k £10. In table 1, it is recommended that 7 to 10 class intervals be used. Let k = 8, then each interval will have probability p = 0.125. The endpoints for each interval are computed from the cdf for the exponential distribution, as follows:
Chi-Square Test forExponential Distribution (cont.) F(ai) = 1 - e-lai (Eq 7) where ai represents the endpoint of the ith interval, i = 1, 2, ..., k. Since F(ai) is the cumulative area from zero to ai , F(ai) = ip, so Equation 7 can be written as ip = 1 - e-lai or e-lai = 1 - ip
Chi-Square Test forExponential Distribution (cont.) Taking the logarithm of both sides and solving for ai gives a general result for the endpoints of k equiprobable intervals for the exponential distribution, namely ai = {-1/l} ln(1 - ip), i = 0, 1, ..., k (Eq 8) Regardless of the value of l , equation 8 will always result in a0 = 0 and ak = ¥. With l = 0.084 and k = 8, a1 is determined from equation 8 as a1 = {-1/0.084}ln(1 - 0.125) = 1.590
Continued application of equation 8 for i = 2, 3, ... 7 results in a2 ,... a7 as 3.425, 5.595, 8.252, 11.677, 16.503, and 24.755. Since k = 8, a8 = ¥. The first interval is [0, 1.590), the second interval is [1.590, 3.425), and so on. The expectation is that 0.125 of the observations will fall in each interval. The observations, expectations, and the contributions to the calculated value of are shown in Table 3. Chi-Square Test forExponential Distribution (cont.)
Chi-Square Test forExponential Distribution (cont.) ClassObserved Frequency, Expected Frequency, (Oi - Ei)2 / Ei Intervlas Oi Ei [0, 1.590) 19 6.25 26.01 [1.590, 3.425) 10 6.25 2.25 [3.425, 5.595) 3 6.25 0.81 [5.595, 8.252) 6 6.25 0.01 [8.252, 11.677) 1 6.25 4.41 [11.677, 16.503) 1 6.25 4.41 [16.503, 24.755) 4 6.25 0.81 [24.755, ¥) 6 6.25 0.81 50 50 39.6 (Table 3) Chi-Square Goodness-of-fit test
The calculated value of is 39.6. The degrees of freedom are given by k - s - 1 = 8 - 1 - 1 = 6. At a = 0.05, the tabulated value of is 12.6. Since , the null hypothesis is rejected. (The value of is 16.8, so the null hypothesis would also be rejected at level of significance a = 0.01.) Chi-Square Test forExponential Distribution (cont.)
Simple Linear Regression Suppose that it is desired to estimate the relationship between a single independent variable x and a dependent variable y. Suppose that the true relationship between y and x is a linear relationship, where the observation, y, is a random variable and x is a mathematical variable. The expected value of y for a given value of x is assumed to be E(y|x) = b0+ b1x (Eq 9) where b0 = intercept on the y axis; an unknown constant; b1 = slope, or change in y for a unit change in x; an unknown constant.
Simple Linear Regression (cont.) It is assumed that each observation of y can be described by the model y = b0+ b1x + e (Eq 10) where e is a random error with mean zero and constant variance s2. The regression model given by equation 10 involves a single variable x and is commonly called a simple linear regression model.
The appropriate test statistic for significance of regression is given by t0 = b1 / Ö (MSE/Sxx) where MSE is the mean squared error. The error is the difference between the observed value yi, and the predicted value, yi, at xi, or ei = yi - yi. The squared error is given by and the mean squared error, given by is an unbiased estimator of s2= V(ei). Simple Linear Regression (cont.)