Download
1 / 24
250 likes | 464 Vues
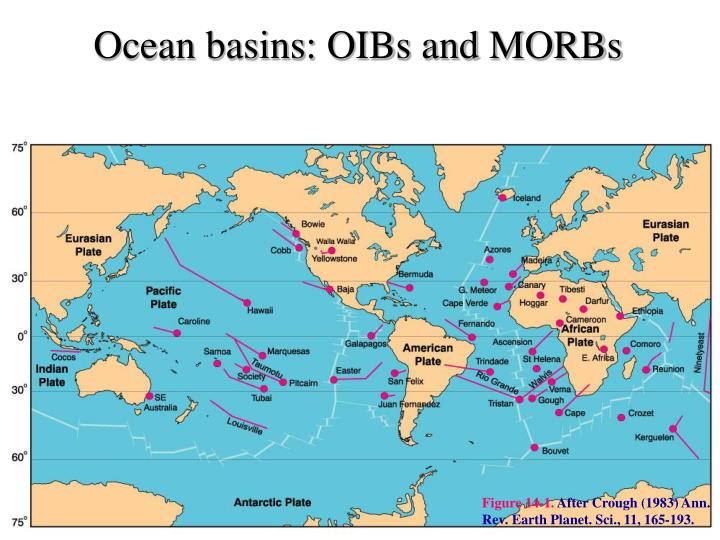
Ocean basins: OIBs and MORBs. Figure 14-1. After Crough (1983) Ann. Rev. Earth Planet. Sci., 11, 165-193. Updates/questions. Next Wednesday review, midterm on April 2nd Lab next week Topics: Systematics for: Mid ocean ridge basalts (oceanic plate) Ocean island basalts (hotspots).

E N D
Ocean basins: OIBs and MORBs Figure 14-1.After Crough (1983)Ann. Rev. Earth Planet. Sci., 11, 165-193.
Updates/questions • Next Wednesday review, midterm on April 2nd • Lab next week • Topics: • Systematics for: • Mid ocean ridge basalts (oceanic plate) • Ocean island basalts (hotspots)
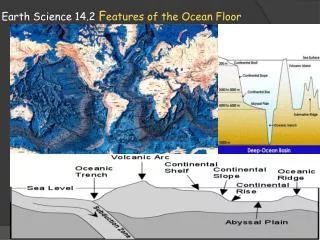
Figure 13-3.Lithology and thickness of a typical ophiolite sequence, based on the Samial Ophiolite in Oman. After Boudier and Nicolas (1985) Earth Planet. Sci. Lett., 76, 84-92.
Oceanic Crust and Upper Mantle Structure Layer 1: sediment Layer 2: a&b: pillows c: sheeted dikes Layer 3: a: transitional gabbros b: layered gabbros -- magma chamber Layer 4: ultramafics -- cumulates, then mantle Figure 13-4. Modified after Brown and Mussett (1993) The Inaccessible Earth: An Integrated View of Its Structure and Composition. Chapman & Hall. London.
12 10 Alkaline 8 %Na2O + K2O 6 4 2 Tholeiitic 55 65 40 60 35 45 50 %SiO2 Petrography and Major Element Chemistry
Crystallization Sequence Constant composition Constant pressure Figure 7-2. After Bowen (1915), A. J. Sci., and Morse (1994), Basalts and Phase Diagrams. Krieger Publishers.
Major elements • MgO and FeO by olivine • Al2O3 and CaO by cpx • SiO2 less in crystals • Na2O, K2O, TiO2, P2O5 all : not in crystals Figure 13-5. “Fenner-type” variation diagrams for basaltic glasses from the Afar region of the MAR. Note different ordinate scales. From Stakes et al. (1984) J. Geophys. Res., 89, 6995-7028.
Trace Element Chemistry Figure 13-10. Data from Schilling et al. (1983) Amer. J. Sci., 283, 510-586.
Conclusions about MORBs • Range in MORB composition due to fractional crystallization • Modeling suggests ~ 60% fractional crystallization • MORBs have > 1 source type: • N-MORB • E-MORB • Transition between them (T-MORB)
12 Ol 10 Alkaline %Na2O + K2O 8 Opx 6 4 Tholeiitic field Alkaline field 2 Tholeiitic 55 65 40 60 35 45 50 %SiO2 Ab Q Ne Dividing line Types of OIB Magmas
Hawaiian Stages-eruptive cycle 1. Pre-shield stage: variable alkaline/tholeiitic 2. Shield-building stage:tholeiitic, 98% of the volcano 3.Post-shield stage more alkaline, more differentiated 4. After ~1Ma break, post-erosional stage:highly alkaline and silica-undersaturated magmas
Evolution in the Series Figure 14-2. After Wilson (1989) Igneous Petrogenesis. Kluwer.
Trace Elements: REEs Enriched Depleted Figure 14-2. After Wilson (1989) Igneous Petrogenesis. Kluwer.
MORB-normalized Spider Diagrams Figure 14-3. Winter (2001) An Introduction to Igneous and Metamorphic Petrology. Prentice Hall. Data from Sun and McDonough (1989).
Isotope Geochemistry • Isotopes do not fractionate during partial melting of fractional melting processes, so will reflect the characteristics of the source • OIBs only cross oceanic plate, limiting contamination (<-> continent); good estimate of mantle
Sr Isotope Evolution Figure 9-13. After Wilson (1989). Igneous Petrogenesis. Unwin Hyman/Kluwer.
Sm-Nd: Evolution opposite to Rb - Sr Ctl Crust (enriched) = hi 87Sr/86Sr, lo 143Nd/144Nd 147Sm143Nd by alpha decay half life 106 Ga Daughter more incompatible • 143Nd/144Nd = (143Nd/144Nd)o + (147Sm/144Nd)(elt-1)
MORB Sr - Nd Isotopes Figure 13-12. Data from Ito et al. (1987) Chemical Geology, 62, 157-176; and LeRoex et al. (1983) J. Petrol., 24, 267-318.
MORB+OIB: Sr - Nd Isotopes Range in compositions = mantle array Every composition by mixing end-members: DM -depleted mantle EM 1&2 - enriched mantle HIMU - high m = 238U/204Pb 238U -> 206Pb So high 206Pb/204Pb DM MORB } OIB (colors) HIMU BSE EM2 EM1
A Model for Oceanic Magmatism Continental Reservoirs DM OIB EM and HIMU from crustal sources (subducted OC + CC seds) Figure 14-10. Nomenclature from Zindler and Hart (1986). After Wilson (1989) and Rollinson (1993).