WP3
420 likes | 630 Vues
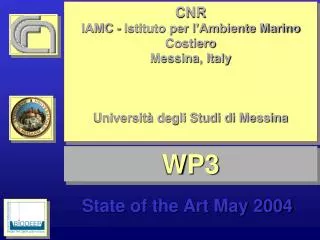
CNR IAMC - Istituto per l’Ambiente Marino Costiero Messina, Italy Università degli Studi di Messina. WP3. State of the Art May 2004. 16 rRNA Distribution at Family level In study: >830 sequences analysed 9 levels for Urania from 3.8% of Salinity to BB

WP3
E N D
Presentation Transcript
CNR IAMC - Istituto per l’Ambiente Marino Costiero Messina, Italy Università degli Studi di Messina WP3 State of the Art May 2004
16 rRNA Distribution at Family level In study: >830 sequences analysed 9 levels for Urania from 3.8% of Salinity to BB 7 Levels for Bannock from 3.9% to 28% of salinity 8 Levels for Discovery from 6.2% of salinity to BB 7 Levels for L’Atalante from 4% of salinity to BB 1st Statistical aproach: Family level (-aceae) 2nd Statistical aproach: Division Level
16S rRNA Bannock Sampling Profile Refraction Index Salinity % Urania Bannock Eh Eh -350 -250 -150 -50 50 -300 -250 -200 -150 -100 -50 0 50 0 1,338 0 1,335 1,34 1,340 1,342 3,8 5 4,2 1,345 3,9 5 6 5,1 1,344 1,350 6,7 9,8 10 10,2 1,346 1,355 11 7,7 8,2 12,8 8,7 1,360 9 1,348 14,4 15 10 15,4 1,365 10,9 10,9 1,35 16,9 19 1,370 1,352 20 20,6 13,4 13,9 1,375 22.4 1,354 14,6 23,2 15 15 15,3 1,380 15,6 25 24.6 16 1,356 1,385 28 1,358 30 1,390 20 1,36 Discovery L’Atalante Eh Eh -350 -300 -250 -200 -150 -100 -50 0 -300 -250 -200 -150 -100 -50 0 50 0 1,34 0 1,335 1,34 4 1,35 4,4 4,8 5 5 5,2 1,345 6,2 7 7 7,8 1,36 9 1,35 10 10 1,355 12,8 1,37 13 15 1,36 15 15,4 1,38 1,365 18 19,4 20 20 1,37 21,2 21,2 1,39 23,8 24 1,375 24,2 24,4 25 25 25,4 25,6 1,4 26 1,38 27,6 30 1,385 30 1,41
nMDS analysis DHABs Diversity (families) Stress: 0,18 Urania Bannock Discovery L'Atalante
nMDS analysis DHABs Diversity (families) Stress: 0,18 A4 Urania U3.8 B28 UBB DBB U5.1 U8.7 B3.9 U15.6 Bannock B12.8 U8.2 U10.9 B16.9 A12,8 A7,8 U14.6 U14 B24.6 B14.4 Discovery A23,8 A19,4 B22.4 D9 D24.4 A27.6 D21.2 ABB D15.4 L'Atalante D26* D17* D6.2
Diversity indexes (families) High diversity – Low dominance Low diversity, High dominance
1. At level of bacterial Family every basin seems to be a different world! 2. There is a grouping made by SW and BB layer………. “Real o Bias?” 3. Urania, Bannock, and L’Atalante shows the highest diversity 4. Urania, Bannock, and L’Atalante shows the lowest dominance 5. Discovery shows lower level of diversity 6. Discovery shows dominance of specific families at medium salinity concentration along the gradient 7. Urania show a regular increasing of diversity along the gradient
Archeon DHABs [CD1] Thermotog. CFB Actinobacteria Candidate division sed 3 KB1 Verrucomicrobiales Clostridiales Flexibact. DHABs[CD2] DHABs[CD3] Spirochaet. Acidobact. Rhizob. Rhodobact. Magnetic Bacterium DHABs[CD4] Desulfuromon. Desulfobact. Desulfoarc. Geobact. Desulfohalob. Desulfobulb. Syntrophobact. SB1 Uncultured Helicobact. Campylobact. Moraxellac. Psudomonad. Oceanospirillales Enterobact. Pisciricketts. Alteromon. UnculturedG Dechlorimarinus Ectothiorhodospir. Chromat. Alcanivorax. Urania Bannock Discovery L’Atalante
Archeon DHABs [CD1] Thermotog. CFB Archeon Flexibact. 0.793 Actinobacteria Archeon Pisciricketts. 0.758 Candidate division sed 3 DHABs [CD1] Helicobact. 0.886 KB1 DHABs [CD1] Pisciricketts. 0.811 Verrucomicrobiales Thermotog. KB1 1 Clostridiales Flexibact. DHABs[CD2] Actinobacteria Moraxellac. 1 DHABs[CD3] Actinobacteria Enterobact. 0.834 Spirochaet. Cand. Div. sed 3 DHABs[CD3] 1 Acidobact. Cand. Div. sed 3 Spirochaet. 1 Rhizob. Cand. Div. sed 3 Magnetic Bacterium 1 Rhodobact. Cand. Div. sed 3 Desulfohalob. 0.837 Magnetic Bacterium KB1 Acidobact. 0.796 DHABs[CD4] Clostridiales Rhizob. 1 Desulfuromon. Clostridiales Geobact. Desulfobact. 0.735 Desulfoarc. Clostridiales Ectothiorhodospir. 1 Geobact. DHABs[CD3] Spirochaet. 1 Desulfohalob. DHABs[CD3] Magnetic Bacterium 1 Desulfobulb. DHABs[CD3] Desulfohalob. 0.837 Syntrophobact. Spirochaet. Magnetic Bacterium 1 SB1 Spirochaet. Desulfohalob. Uncultured 0.837 Helicobact. Acidobact. Desulfobact. 0.766 Campylobact. Acidobact. Desulfobulb. 0.785 Moraxellac. Rhizob. Geobact. 0.735 Psudomonad. Rhizob. Ectothiorhodospir. 1 Oceanospirillales Magnetic Bacterium Desulfohalob. 0.837 Enterobact. Geobact. Ectothiorhodospir. 0.735 Pisciricketts. Alteromon. Helicobact. Campylobact. 0.736 UnculturedG Helicobact. Pisciricketts. 0.782 Dechlorimarinus Moraxellac. Enterobact. 0.834 Ectothiorhodospir. Psudomonad. Enterobact. 0.977 Chromat. Alcanivorax. Urania Direct and Inverse Correlations (Pearson’s test, P<0.05 (uncorr))
Archeon DHABs [CD1] Thermotog. CFB Archeon Desulfobulb. 0,983 Actinobacteria DHABs [CD1] Desulfobact. 0,794 Candidate division sed 3 CFB Desulfoarc. 1 KB1 CFB UnculturedG 1 Verrucomicrobiales Actinobacteria Pisciricketts. 0,735 Clostridiales Cand. Div. sed 3 Clostridiales Flexibact. 0,936 DHABs[CD2] Cand. Div. sed 3 DHABs[CD2] 0,807 DHABs[CD3] KB1 Verrucomicrobiales 0,99 1 Spirochaet. KB1 DHABs[CD3] 0,938 Acidobact. Rhizob. KB1 SB1 0,839 Rhodobact. Verrucomicrobiales DHABs[CD3] 0,879 Magnetic Bacterium DHABs[CD4] Verrucomicrobiales SB1 0,79 Desulfuromon. Clostridiales Acidobact. 0,729 Desulfobact. Clostridiales Geobact. Desulfoarc. 0,729 Geobact. Flexibact. Moraxellac. 1 Desulfohalob. Flexibact. Psudomonad. 0,821 Desulfobulb. DHABs[CD3] Desulfohalob. 0,704 Syntrophobact. DHABs[CD3] SB1 0,888 SB1 Acidobact. Geobact. 1 Uncultured DHABs[CD3] Helicobact. Enterobact. -0,701 Campylobact. Desulfoarc. UnculturedG 1 Moraxellac. Desulfohalob. Alteromon. 0,76 Psudomonad. Moraxellac. Psudomonad. 0,821 Oceanospirillales SB1 Psudomonad. -0,74 Enterobact. Pisciricketts. Alteromon. UnculturedG Dechlorimarinus Ectothiorhodospir. Chromat. Alcanivorax. Urania Bannock Direct and Inverse Correlations (Pearson’s test, P<0.05 (uncorr))
Archeon DHABs [CD1] Thermotog. CFB Actinobacteria Candidate division sed 3 Archeon Clostridiales 1 KB1 Archeon Spirochaet. 1 Verrucomicrobiales Archeon Dechlorimarinus 0,844 Clostridiales CFB Acidobact. 0,722 Flexibact. 2 CFB Ectothiorhodospir. 0,896 DHABs[CD2] KB1 Verrucomicrobiales DHABs[CD3] 0,851 Spirochaet. Clostridiales Spirochaet. 1 Acidobact. Clostridiales Dechlorimarinus 0,844 Rhizob. Flexibact. Rhodobact. 1 Rhodobact. Flexibact. Desulfobulb. 1 Magnetic Bacterium DHABs[CD2] UnculturedG 0,755 DHABs[CD4] DHABs[CD2] Chromat. 1 Desulfuromon. Spirochaet. Dechlorimarinus 0,844 Desulfobact. Rhodobact. Desulfobulb. 1 Desulfoarc. DHABs[CD4] Desulfuromon. 0,751 Geobact. DHABs[CD4] Ectothiorhodospir. Desulfohalob. 0,722 Desulfobulb. Desulfobact. SB1 0,761 Syntrophobact. Desulfobact. Alcanivorax. 0,736 SB1 SB1 Alcanivorax. 0,777 Uncultured Psudomonad. Alteromon. 0,889 Helicobact. UnculturedG Chromat. 0,755 Campylobact. Dechlorimarinus Alcanivorax. 0,84 Moraxellac. Psudomonad. Oceanospirillales Enterobact. Pisciricketts. Alteromon. UnculturedG Dechlorimarinus Ectothiorhodospir. Chromat. Alcanivorax. Discovery Direct and Inverse Correlations (Pearson’s test, P<0.05 (uncorr))
Archeon DHABs [CD1] Thermotog. CFB Actinobacteria Candidate division sed 3 DHABs [CD1] DHABs[CD2] 1 KB1 Verrucomicrobiales Clostridiales KB1 Pisciricketts. -0,725 Flexibact. DHABs[CD2] DHABs[CD3] Rhodobact. Campylobact. 0,766 Spirochaet. Acidobact. Rhizob. Campylobact. Pisciricketts. 0,828 Rhodobact. Magnetic Bacterium DHABs[CD4] Oceanospirillales Alcanivorax. 1 Desulfuromon. Desulfobact. Desulfoarc. Geobact. Desulfohalob. Desulfobulb. Syntrophobact. SB1 Uncultured Helicobact. Campylobact. Moraxellac. Psudomonad. Oceanospirillales Enterobact. Pisciricketts. Alteromon. UnculturedG Dechlorimarinus Ectothiorhodospir. Chromat. Alcanivorax. L’Atalante Direct and Inverse Correlations (Pearson’s test, P<0.05 (uncorr))
1. There are a specific DHABs Configuration 2. There are some unique and sporadic phylotypes (probably “contamination”?) 3. There are Specific direct correlations within tipical DHABs flora. 4. Gamma proteobacteria shows to be often inverse related with typical DHABs Flora 5. Discovery Basin show a peculiar configuration with two big groups(KB1 and Desulfobatcereaceae) domainig two different layer of the basin interface 6. In Discovery and Bannock Basin KB1 and Verrucomicrobiales go very well related along the basin interface gradient 8. In Atalante, there are very well defined bacterial distributions
nMDS analysis DHABs Groups (Divisons) Stress: 0,16 Urania Bannock Discovery L'Atalante 2nd Statistical aproach: Divisions Level
nMDS analysis DHABs Groups (Divisons) Stress: 0,16 U3.8 A4 Urania UBB DBB A12,8 B28 A7,8 B3.9 B12.8 Bannock B16.9 D6.2 D9 ABB A19,4 U14.6 A23,8 B22.4 Discovery B14.4 U14 B24.6 L'Atalante
nMDS analysis DHABs Groups (Divisons) Stress: 0,16 U3.8 A4 U5.1 Urania UBB DBB U15.6 A12,8 B28 A7,8 U8.7 B3.9 B12.8 U8.2 Bannock U10.9 B16.9 D6.2 D9 ABB A19,4 U14.6 A23,8 B22.4 Discovery B14.4 U14 B24.6 L'Atalante
nMDS analysis U3.8 A4 U5.1 UBB DBB U15.6 A12,8 B28 A7,8 U8.7 B3.9 B12.8 U8.2 U10.9 B16.9 D6.2 D9 ABB A19,4 U14.6 A23,8 B22.4 B14.4 U14 D15.4 D26* B24.6 D24.4 A27.6 D17* D21.2 DHABs Groups (Divisons) Stress: 0,16 Urania Bannock Discovery L'Atalante
At level of functional group: 1. There is a common significance that join the more saline Urania layers with the Bannock and Atalante basins 2. Discovery maintains its peculiar bizarre world 3. Some layers of Urania seems to drop out from the common distribution
nMDS analysis DHABs [CD1] Stress: 0,16 U3.8 A4 U5.1 UBB DBB U15.6 A12,8 B28 A7,8 U8.7 B3.9 B12.8 U8.2 U10.9 B16.9 D6.2 D9 ABB A19,4 U14.6 A23,8 B22.4 B14.4 U14 D15.4 D26* B24.6 D24.4 A27.6 D17* D21.2
nMDS analysis DHABs CFB Stress: 0,16 U3.8 A4 U5.1 UBB DBB U15.6 A12,8 B28 A7,8 U8.7 B3.9 B12.8 U8.2 U10.9 B16.9 D6.2 D9 ABB A19,4 U14.6 A23,8 B22.4 B14.4 U14 D15.4 D26* B24.6 D24.4 A27.6 D17* D21.2
nMDS analysis DHABs Actinobactereaceae Stress: 0,16 U3.8 A4 U5.1 UBB DBB U15.6 A12,8 B28 A7,8 U8.7 B3.9 B12.8 U8.2 U10.9 B16.9 D6.2 D9 ABB A19,4 U14.6 A23,8 B22.4 B14.4 U14 D15.4 D26* B24.6 D24.4 A27.6 D17* D21.2
nMDS analysis DHABs Candidate Division Sediment 3 Stress: 0,16 U3.8 A4 U5.1 UBB DBB U15.6 A12,8 B28 A7,8 U8.7 B3.9 B12.8 U8.2 U10.9 B16.9 D6.2 D9 ABB A19,4 U14.6 A23,8 B22.4 B14.4 U14 D15.4 D26* B24.6 D24.4 A27.6 D17* D21.2
nMDS analysis DHABs KB1 Stress: 0,16 U3.8 A4 U5.1 UBB DBB U15.6 A12,8 B28 A7,8 U8.7 B3.9 B12.8 U8.2 U10.9 B16.9 D6.2 D9 ABB A19,4 U14.6 A23,8 B22.4 B14.4 U14 D15.4 D26* B24.6 D24.4 A27.6 D17* D21.2
nMDS analysis DHABs Verrucomicrobiales Stress: 0,16 U3.8 A4 U5.1 UBB DBB U15.6 A12,8 B28 A7,8 U8.7 B3.9 B12.8 U8.2 U10.9 B16.9 D6.2 D9 ABB A19,4 U14.6 A23,8 B22.4 B14.4 U14 D15.4 D26* B24.6 D24.4 A27.6 D17* D21.2
nMDS analysis DHABs [CD2] Stress: 0,16 U3.8 A4 U5.1 UBB DBB U15.6 A12,8 B28 A7,8 U8.7 B3.9 B12.8 U8.2 U10.9 B16.9 D6.2 D9 ABB A19,4 U14.6 A23,8 B22.4 B14.4 U14 D15.4 D26* B24.6 D24.4 A27.6 D17* D21.2
nMDS analysis DHABs [CD3] Stress: 0,16 U3.8 A4 U5.1 UBB DBB U15.6 A12,8 B28 A7,8 U8.7 B3.9 B12.8 U8.2 U10.9 B16.9 D6.2 D9 ABB A19,4 U14.6 A23,8 B22.4 B14.4 U14 D15.4 D26* B24.6 D24.4 A27.6 D17* D21.2
nMDS analysis DHABs Spiro Stress: 0,16 U3.8 A4 U5.1 UBB DBB U15.6 A12,8 B28 A7,8 U8.7 B3.9 B12.8 U8.2 U10.9 B16.9 D6.2 D9 ABB A19,4 U14.6 A23,8 B22.4 B14.4 U14 D15.4 D26* B24.6 D24.4 A27.6 D17* D21.2
nMDS analysis DHABs Acidobactereaceae Stress: 0,16 U3.8 A4 U5.1 UBB DBB U15.6 A12,8 B28 A7,8 U8.7 B3.9 B12.8 U8.2 U10.9 B16.9 D6.2 D9 ABB A19,4 U14.6 A23,8 B22.4 B14.4 U14 D15.4 D26* B24.6 D24.4 A27.6 D17* D21.2
nMDS analysis DHABs [CD4] Stress: 0,16 U3.8 A4 U5.1 UBB DBB U15.6 A12,8 B28 A7,8 U8.7 B3.9 B12.8 U8.2 U10.9 B16.9 D6.2 D9 ABB A19,4 U14.6 A23,8 B22.4 B14.4 U14 D15.4 D26* B24.6 D24.4 A27.6 D17* D21.2
nMDS analysis DHABs Alpha Proteobacteria Stress: 0,16 U3.8 A4 U5.1 UBB DBB U15.6 A12,8 B28 A7,8 U8.7 B3.9 B12.8 U8.2 U10.9 B16.9 D6.2 D9 ABB A19,4 U14.6 A23,8 B22.4 B14.4 U14 D15.4 D26* B24.6 D24.4 A27.6 D17* D21.2
nMDS analysis DHABs Delta Proteobacteria Stress: 0,16 U3.8 A4 U5.1 UBB DBB U15.6 A12,8 B28 A7,8 U8.7 B3.9 B12.8 U8.2 U10.9 B16.9 D6.2 D9 ABB A19,4 U14.6 A23,8 B22.4 B14.4 U14 D15.4 D26* B24.6 D24.4 A27.6 D17* D21.2
nMDS analysis DHABs Epsilon Proteobacteria Stress: 0,16 U3.8 A4 U5.1 UBB DBB U15.6 A12,8 B28 A7,8 U8.7 B3.9 B12.8 U8.2 U10.9 B16.9 D6.2 D9 ABB A19,4 U14.6 A23,8 B22.4 B14.4 U14 D15.4 D26* B24.6 D24.4 A27.6 D17* D21.2
nMDS analysis DHABs SB1 Stress: 0,16 U3.8 A4 U5.1 UBB DBB U15.6 A12,8 B28 A7,8 U8.7 B3.9 B12.8 U8.2 U10.9 B16.9 D6.2 D9 ABB A19,4 U14.6 A23,8 B22.4 B14.4 U14 D15.4 D26* B24.6 D24.4 A27.6 D17* D21.2
nMDS analysis DHABs Gamma Proteobacteria Stress: 0,16 U3.8 A4 U5.1 UBB DBB U15.6 A12,8 B28 A7,8 U8.7 B3.9 B12.8 U8.2 U10.9 B16.9 D6.2 D9 ABB A19,4 U14.6 A23,8 B22.4 B14.4 U14 D15.4 D26* B24.6 D24.4 A27.6 D17* D21.2
> Gamma [] [] [] Epsilon Desulfobac>Desulfobulb Archaea–Desulfobact (D) Geobactereaceae HIGH DIVERSITY ZONE KB1+Verr>Desulfobact. (D) Desulfohalob> Desulfobact Desulfobulb>Desulfobact(B) KB1+Verr (D) > Gamma [] [] []
Ba++ Sulphate Sulphide Sulphur Mn++ * MnO2 Ba++ Mn2+ Manganese oxidisers Ba++ Arcobacter 16SrRNA Fe(OH)3 * * e- SO42- FeRB e- SRB e- S0 Fe2+ Geobacteriaceae 16SrRNA dsrAB func.genes S- * e- e- CO2 Methanogens AOM and Methanohalophilus 16SrRNA CH4 -313 Eh:-232 * Evidence of in situ active cells or functional genes involved in the pathways RedOx Potential Proposed metabolic pathways in the DHABs O2 Oxic 3380dbar NO3 MnO2 Anoxic Volatile fatty acids (FeOH)3 Acetate e- SO42- e- e- e- CO2 e- e- CO2 e- e- e-
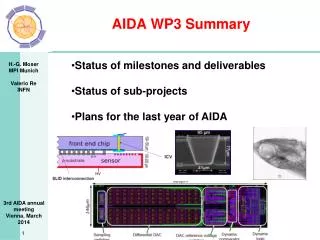
Discovery Functional charachterisation In study: Distribution along the Discovery salinity graident of: Anaerobic Methane Oxidation related (ANME) bacteria (rRNA) Desulfobatcteraceae distribution (16rRNA) DSR Subunit A gene (RNA) DSR Subunit B gene (RNA)
AMO-11%-B24 AMO-19%-6 Halogeometricum borinquense AMO-19%-7 Halophilic Metanogens Halophilic archaeon PalaeII AMO-11%-2 AMO-11%-3 and ANME A20-11%-19 ANME-2c A20-11%-11 Deep Hidrotermal Unidentified archaeon Methanohalophilus euhalobius AMO-19%-5 AMO11%-10 Vent Environment Methanohalophilus portucalensis AMO-11%-1 AMO11%-5 Group 3 AMO11%-9 A20-11%-B2 Uncultured archaeon SAGMA-10 A20-6%-12 Unidentified Crenoarchaeota A20-6%-8 Uncultured archaeon 19a-14 A20-6%-29 Uncultured Crenoarchaeota A20-11%-B1 A20-6%-27 Discovery Anaerobic Methane Oxidation related (ANME) - bacteria (16SrRNA) Methanocaldococcus sp. Methanococcus voltae Methanococcus aeolicus Methanothermococcus okinawensis 0.1
SRB clones at 6% salinity SRB clones at 11% salinity Discovery Desulfobactereaceae distribution clones - bacteria (16SrRNA) 6%-19 Desulfobacula sp. Desulfotignum phosphitoxidans Desulfospira joergensenii Desulfobacula toluolica Desulfobacterium vacuolatum 11%-35 6%-26 6%-22 6%-21 6%-3 6%-35 11%-20 Desulfobacterium phenolicum 11%-31 Uncultured clone DLIB-25 6%-5 Uncultured clone DBBB-72 6%-36 0.1 Desulfobacula toluolica 6%-7
Thermodesulfobacterium commune Desulforhopalus vacuolatus Guaymas basin clone B04P001 Desulfobacter latus U58124 Desulfococcus multivorans Guaymas basin clone B01P020 Desulforhabdus amnigena 11%-51 11%-82 Guaymas basin clone B01P012 Thermodesulforhabdus Desulfobacterium vacuolatum Desulfotignum balticum norvegica Desulfobacula toluolica 11%-54 Desulfoarculus baarsii KYF_135 Desulfotomaculum thermobenzoicum Desulfovibrio vulgaris Desulfovibrio desulfuricans 11%-82 Desulfotomaculum putei Desulfosporosinus orientensis Desulfotomaculum alkaliphilum sp. MGP Pelotomaculum 0.1 SRB clones at 6% salinity SRB clones at 11% salinity Thermodesulfovibrio islandicus Archaeoglobus fulgidus M95624 Discovery basin SRB clones 6-11% Dissimilatory sulfite reductase Alpha subunit (dsrA)
Desulforhopalus singaporensis Desulforhopalus vacuolatus 11%-77 B01P020 Desulfovibrio desulfuricans Desulfovibrio vulgaris Desulfoarculus baarsii Desulfococcus multivorans Desulfobacula toluolica Desulfotomaculum putei 11%-51 Desulfotignum balticum Desulfobacterium vacuolatum Guaymas basin clone B04P001 Thermodesulfovibrio yellowstonii Thermodesulfovibrio islandicus Desulfotomaculum thermobenzoicum Desulfomonile tiedjei 0.1 SRB clones at 6% salinity Thermodesulforhabdus norvegica Thermodesulfobacterium commune SRB clones at 11% salinity Desulforhabdus amnigena sp. MGP Pelotomaculum Discovery basin SRB clones 6-11% Dissimilatory sulfite reductase Beta subunit (dsrB)
- Archaea 1. At 6% of salinity of Discovery basin we found only members related to crenoarcheota division 2. At 11% and 19% the new DHVE3 3. The anaerobic methanophiles was found at 11% and 19% of salinity - Bacteria 4. 16SrRNA from 6% and 11% of salinity shows mainly Desulfobacteraceae related bacteria 5. dsrA and dsrB distribution shows two levels of diversity (macro and micro) 6. the dsr clusters related to the Desulfobacteriaceae show an high ratio of microdiversity with two defined sub-clusters: i) 6% of salinity clones ii) 6% and 11% togeter