Download
1 / 71
720 likes | 874 Vues
Failure Mode and Effect Analysis. TOTAL QUALITY MANAGEMENT. F.M.E.A. What is an F.M.E.A.? Why do we need it? When do we do it? What do we do when it’s finished?. Introduction. What is a Failure Mode and Effect Analysis?. F.M.E.A. is a simple way of predicting what might go wrong.

E N D
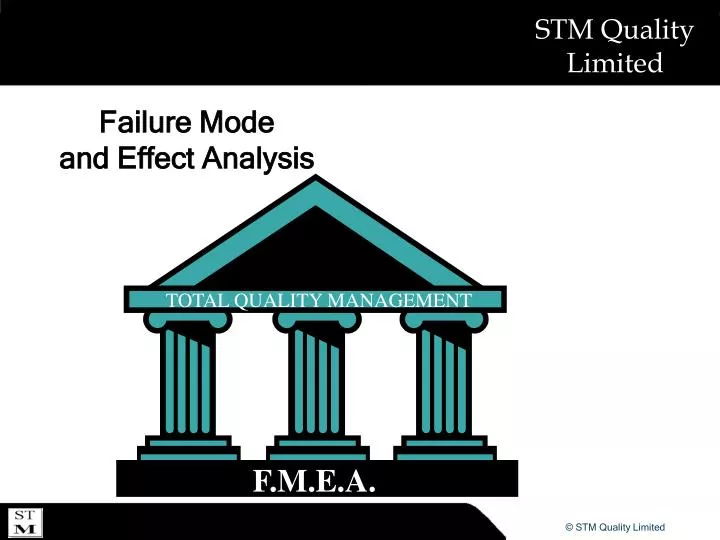
Failure Mode and Effect Analysis TOTAL QUALITY MANAGEMENT F.M.E.A.
What is an F.M.E.A.? Why do we need it? When do we do it? What do we do when it’s finished? Introduction
What is aFailure Mode and Effect Analysis? • F.M.E.A. is a simple way of predicting what might go wrong. • By using a structured method,results can be quantified and hence compared.
How Does It Work? • Identifies critical and significant characteristics • Helps engineers prioritise and focus on eliminating product and process concerns and help prevent problems from occurring.
Purpose • Utilise individuals’ knowledge and skills within a team environment • Identify potential failures at the earliest possible stage of new design/process
Failure Mode and Effect Analysis • F.M.E.A.s can be done for any design, manufacturing or in-service activity • F.M.E.A.s are modular and can be carried out for single parts or large assemblies
F.M.E.A. - Types System Design FMEA Sub-System Component System Assembly Sub-System Process FMEA Component System Manufacturing Sub-System Component
Benefits – Design F.M.E. A. • Aids in evaluating requirements and alternatives • Aids in initial Design for Manufacture • Increases probability of detecting failuremodes and their effects • Provides additional information for testing requirements • Helps identify critical and significantcharacteristics • Helps validate test methods
Benefits – Process F.M.E. A. • Identifies potential process related failuremodes which will effect internal/external customers • Reduces costs of repairs due to faulty process methodology • Increases efficiency • Establishes a priority system for considering corrective actions • Identifies confirmed critical and significantcharacteristics
F.M.E. A. and Control Plans Identifies Risks F.M.E.A How Risks are Controlled Control Plan
Potential Failure Mode and Effects Analysis ___ System FMEA Number: Design Responsibility: ___ Subsystem Page 1 of 1 Key Date: ___ Component Prepared by: Model Year / Vehicle(s): FMEA Date ( Orig): (Rev) Core Team: Action Results Potential Potential S C Potential O Current D R Responsibility & O R S D Item e c e P Recommended Failure Effect(s) e l Cause(s)/ c Design e P Target Actions v c t N Action(s) Mode of Failure v a Mechanisms c Controls t N Completion Date Taken s Failure u e Function s r c F.M.E.A. Model
To meet Customer Requirements – A.P.Q.P. To keep up with competition To retain current business Help obtain new business Why Do A Failure Mode and Effect Analysis?
Generating F.M.E.A.s Who initiates? How is FMEA documented? When started and updated? Who prepares? Failure Mode and Effects Analysis When is FMEA complete? Who updates? Who is FMEA customer? When to discard?
FM.E.A.s are living documents and are updated when: Modification to a component, process or system is planned; Component is to be used in new environment; Customer concern arises. Managing F.M.E.A.s
Firstly, create a flow chart of operations Then identify boundary for analysis Next, create a flow chart for one operation Process Flow Chart
Transport raw materials Process Flow Chart of Operations Op.10 Preparation Op.20 Mould Op.30 Weld Op.40 assemble Op.50 Trim to size Op.60 Inspect & Pack Store/Pack Boundary for analysis
Place part on trim machine fixture Boundary For Analysis Op.50 Trim Op.50.1 Op.50.2 Press ‘Start’ button Op.50.3 Remove from fixture when cycle complete
Potential Failure Mode and Effects Analysis ___ System FMEA Number: Design Responsibility: ___ Subsystem Page 1 of 1 Key Date: ___ Component Prepared by: Model Year / Vehicle(s): FMEA Date ( Orig): (Rev) Core Team: Action Results Potential Potential S C Potential O Current D R Responsibility & O R S D Item e c e P Recommended Failure Effect(s) e l Cause(s)/ c Design e P Target Actions v c t N Action(s) Mode of Failure v a Mechanisms c Controls t N Completion Date Taken s Failure u e Function s r c Process/Function Requirements
From Process flow: Enter a simple description of the process being analysed i.e. Place part on trim machine fixture; Indicate the purpose of the process being analysed i.e. Fully seat part in correct orientation; List separately other operations involved with that process; Process function contains both product and process characteristics. Process/Function Requirements
What does the process do at this operation? What is the process purpose? What is its function? Define the Process Purpose
Place part on trim machine fixture Process Purpose Op.50 Trim • Locate part on fixture - correct orientation - fully seated • Start trimming programme • Position in checking fixture - fully seated • Remove waste before packing Op.50.1 Op.50.2 Press ‘Start’ button Op.50.3 Remove from fixture when cycle complete
Potential Failure Mode and Effects Analysis ___ System FMEA Number: Design Responsibility: ___ Subsystem Page 1 of 1 Key Date: ___ Component Prepared by: Model Year / Vehicle(s): FMEA Date ( Orig): (Rev) Core Team: Action Results Potential Potential S C Potential O Current D R Responsibility & O R S D Item e c e P Recommended Failure Effect(s) e l Cause(s)/ c Design e P Target Actions v c t N Action(s) Mode of Failure v a Mechanisms c Controls t N Completion Date Taken s Failure u e Function s r c Determine What Can Go Wrong
Definition: Potential failure mode is the manner in which the process could potentially fail to meet the process requirements and/or design intent. It is a description of the non-conformance at that specific operation. Failure Mode
Examine process flow using: No function Partial function Intermittent function Failure Mode
Potential Failure Mode and Effects Analysis ___ System FMEA Number: Design Responsibility: ___ Subsystem Page 1 of 1 Key Date: ___ Component Prepared by: Model Year / Vehicle(s): FMEA Date ( Orig): (Rev) Core Team: Action Results Potential Potential S C Potential O Current D R Responsibility & O R S D Item e c e P Recommended Failure Effect(s) e l Cause(s)/ c Design e P Target Actions v c t N Action(s) Mode of Failure v a Mechanisms c Controls t N Completion Date Taken s Failure u e Function s r c Effects Of Failure Mode
Definition: The effects of the failure mode on the customer. The customer could be the next operation, subsequent operations or the final customer / user. Effects of Failure Mode
Identify potential effects on: next user downstream user ultimate customer vehicle operation operator safety Compliance with government regulations machines / equipment Effects of Failure Mode
Failure mode Effects of Failure Next user Downstream users Ultimate customer Vehicle operation Operator safety Government regulations
Failure mode Effects of Failure Failure mode: Incorrect Trim Programme Next user Downstream users Ultimate customer Vehicle operation Operator safety Government regulations Incorrect to checking fixture Packaged in wrong stillage Cannot fit to vehicle. Stop Production line Cannot fit to vehicle None None
Potential Failure Mode and Effects Analysis ___ System FMEA Number: Design Responsibility: ___ Subsystem Page 1 of 1 Key Date: ___ Component Prepared by: Model Year / Vehicle(s): FMEA Date ( Orig): (Rev) Core Team: Action Results Potential Potential S C Potential O Current D R Responsibility & O R S D Item e c e P Recommended Failure Effect(s) e l Cause(s)/ c Design e P Target Actions v c t N Action(s) Mode of Failure v a Mechanisms c Controls t N Completion Date Taken s Failure u e Function s r c Severity
Definition: An assessment of the seriousness of the effect of the potential failure mode on the customer. Severity
Hazardous without warning Suggested Severity Scoring Effect Criteria: Severity of Effect Ranking • May endanger machine or assembly operator…non compliance government regulation without warning 10 Hazardous with warning • May endanger machine or assembly operator…non compliance government regulation without warning 9 Low Minor disruption to production line 100% of product may have to be reworked 5 None No Effect 1
Potential Failure Mode and Effects Analysis ___ System FMEA Number: Design Responsibility: ___ Subsystem Page 1 of 1 Key Date: ___ Component Prepared by: Model Year / Vehicle(s): FMEA Date ( Orig): (Rev) Core Team: Action Results Potential Potential S C Potential O Current D R Responsibility & O R S D Item e c e P Recommended Failure Effect(s) e l Cause(s)/ c Design e P Target Actions v c t N Action(s) Mode of Failure v a Mechanisms c Controls t N Completion Date Taken s Failure u e Function s r c Critical or Special Characteristic
Identify Special Characteristics CRITICAL:Requirements that affect compliance with government regulations or safe vehicle / product function and require special controls (Score = 9 or 10) SIGNIFICANT: Product and/or test requirements important for customer satisfaction, summarized on Control Plan and require special controls (Score = 5 to 8,)
Potential Failure Mode and Effects Analysis ___ System FMEA Number: Design Responsibility: ___ Subsystem Page 1 of 1 Key Date: ___ Component Prepared by: Model Year / Vehicle(s): FMEA Date ( Orig): (Rev) Core Team: Action Results Potential Potential S C Potential O Current D R Responsibility & O R S D Item e c e P Recommended Failure Effect(s) e l Cause(s)/ c Design e P Target Actions v c t N Action(s) Mode of Failure v a Mechanisms c Controls t N Completion Date Taken s Failure u e Function s r c Cause
Definition: Potential cause of a failure is defined as how the failure could occur in terms of something that can be corrected or controlled. Cause
Only specific errors or malfunctions (eg. Operator fails to remove waste) should be listed. Ambiguous phrases (e.g. Operator error, machine malfunction) should not be used. Cause
Potential Failure Mode and Effects Analysis ___ System FMEA Number: Design Responsibility: ___ Subsystem Page 1 of 1 Key Date: ___ Component Prepared by: Model Year / Vehicle(s): FMEA Date ( Orig): (Rev) Core Team: Action Results Potential Potential S C Potential O Current D R Responsibility & O R S D Item e c e P Recommended Failure Effect(s) e l Cause(s)/ c Design e P Target Actions v c t N Action(s) Mode of Failure v a Mechanisms c Controls t N Completion Date Taken s Failure u e Function s r c Occurrence
How frequently the cause is projected to occur. Based on: Historical manufacturing/assembly failure rates with similar parts Statistical data from similar process Existing process controls Customer concern data Rejects, PPM, Warranty data Occurrence
Very high Suggested Occurrence Scoring Probability Possible Failure Rates Ranking • About 1 in 2 10 9 • About 1 in 3 Moderate • About 1 in 80 6 • About 1 in 400 5 4 • About 1 in 2000 Remote Less than 1 in 500,000 1
Potential Failure Mode and Effects Analysis ___ System FMEA Number: Design Responsibility: ___ Subsystem Page 1 of 1 Key Date: ___ Component Prepared by: Model Year / Vehicle(s): FMEA Date ( Orig): (Rev) Core Team: Action Results Potential Potential S C Potential O Current D R Responsibility & O R S D Item e c e P Recommended Failure Effect(s) e l Cause(s)/ c Design e P Target Actions v c t N Action(s) Mode of Failure v a Mechanisms c Controls t N Completion Date Taken s Failure u e Function s r c Controls
Increasing inspection is only a temporary measure. Permanent Corrective Action is required. Emphasis must be placed on preventingdefectsrather than detecting them (e.g. S.P.C.) Controls
In Process Control column on FMEA: Prevention Controls Place a ‘P’ before each prevention control listed Detection Controls Place a ‘D’ before each detection control listed Controls
Prevention: (Preferred option) Prevent the cause / mechanism of failure or the failure mode occurring, or reduce their rate of occurrence Prevention Controls
Detection: Detect the cause / mechanism of failure or the failure mode and lead to corrective actions Detection Controls
Engineering specification tests Poka-yoke or error proofing Audible or visual warning devices In Process / Final inspection S.P.C. Process / Parameter audits Process Control Examples
Potential Failure Mode and Effects Analysis ___ System FMEA Number: Design Responsibility: ___ Subsystem Page 1 of 1 Key Date: ___ Component Prepared by: Model Year / Vehicle(s): FMEA Date ( Orig): (Rev) Core Team: Action Results Potential Potential S C Potential O Current D R Responsibility & O R S D Item e c e P Recommended Failure Effect(s) e l Cause(s)/ c Design e P Target Actions v c t N Action(s) Mode of Failure v a Mechanisms c Controls t N Completion Date Taken s Failure u e Function s r c Detection
Definition: Detection is an assessment of the probability that: The process controls listed will detect a potential cause /mechanism (process weakness) , or The process controls listed will detect a subsequent failure mode. Detection
Certain Suggested Detection Scoring Detection Likelihood of Detection Ranking • Process control will not and/or cannot detect a potential cause … or there is no process control 10 Moderate Moderately high chance the process control will detect potential cause 4 Almost certain Process control will almost certainly detect a potential cause 1