Download
1 / 32
330 likes | 452 Vues
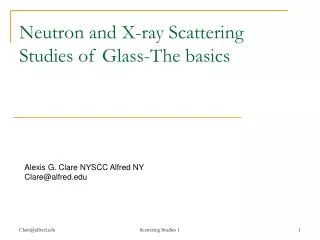
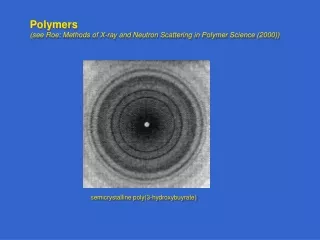
Neutron and X-ray Scattering Studies of Glass-The Experiments and Data Mining. Alexis G. Clare NYSCC Alfred NY Clare@alfred.edu. Outline. Planar Density from Monday Review intensity to correlation function for neutrons X-rays Experimental layouts Interpreting the correlation functions.

E N D
Neutron and X-ray Scattering Studies of Glass-The Experiments and Data Mining Alexis G. Clare NYSCC Alfred NY Clare@alfred.edu Scattering Studies 2
Outline • Planar Density from Monday • Review intensity to correlation function for neutrons • X-rays • Experimental layouts • Interpreting the correlation functions Structure of Glass: Section being lectured
Planes in crystals Adapted from Fig. 3.1(a), Callister 6e. a a √2a/2 7 Structure of Glass: Section being lectured
Basic Properties of X-rays and Neutrons Structure of Glass: Section being lectured
Real Space Correlation Function Older papers present data as the radial distribution function, whereas modern studies employ the differential correlation function, d(r), or the total correlation function, t(r). Structure of Glass: Section being lectured
You can’t get to Infinity from Here Either • Why do we Fourier Transform Qi(Q)? • Truncation of the Fourier Integral • How the way you truncate affects your real space correlation function • How high should you go in Q anyway? Structure of Glass: Section being lectured
Truncation of the Fourier Integral Structure of Glass: Section being lectured
Termination of Fourier Integral • Data collection cannot go to infinite Q • A bigger Q gives you better resolution in real space • Step function termination introduces high frequency ripples in the real space correlation function so use artificial temperature function or Lorch function Structure of Glass: Section being lectured
Neutron Peak Function The termination of the Fourier integral at a finite value of Q, Qmax, means that the correlation function is broadened by the real space peak function, P(r). The form of P(r) depends on the modification function, M(Q): A: Lorch function. B: Artificial temperature factor. C: Step function. Structure of Glass: Section being lectured
Detail on the math etc. • The Structure of Amorphous Solids by X-ray and Neutron Diffraction A.C.Wright Advances in Structure Research by Diffraction Methods 5 (1974) Pergamon Press ISBN 0 08 017287 3 Structure of Glass: Section being lectured
Coherent Scattering in X-rays • For no change in quantum state you can integrate the scattering over all ω to give Structure of Glass: Section being lectured
What about Compton • It is difficult to account for the Compton Scattering because • It is usually really big • It interferes with the elastic peak Energy Analysis At one value of Q0 Q0 I Q Structure of Glass: Section being lectured
Experimental Arrangements X-rays 2θ Source X-ray Tube (Ag) Energy Analyzer SiLi or GeLi Detector + Pulse Height Analyzer Structure of Glass: Section being lectured
Neutron Diffraction Techniques Structure of Glass: Section being lectured
ILL D4c Amorphous Materials Diffractometer Structure of Glass: Section being lectured
ISIS GEM Spectrometer A.C. Hannon, Nucl. Instrum. Meth. Phys. Res.A551 (2005), 88-107. Structure of Glass: Section being lectured
Stay Awake Question Structure of Glass: Section being lectured
Corrections • Background: • cosmic and instrumental • cylinder is complicated; plane is easy • Instrumental eliminated by evacuation or helium • Absorption and multiple scattering • X-rays absorption>> multiple scattering • Neutrons easy if is small and sample is not in a can Structure of Glass: Section being lectured
Corrections • Neutron multiple scattering: • If multiple scattering <10% it is isotropic can be subtracted • Anomalous Dispersion if wavelength is close to an absorption edge f or b can become complex Structure of Glass: Section being lectured
Corrections • X-ray • Polarization: unpolarized light is assumed but this is not realistic • Residual Compton from the monochromator • Neutron • Departure from static approximation (that we integrate along ω-Q0 space and is corrected for by an expansion of the self scattering • The bottom line is that if your Placzek corrections don’t work you get a droopy i(Q) • Other Corrections • Beam Fluctuations • Detector/electronic dead time • Extrapolation to Q=0 Structure of Glass: Section being lectured
Normalization • Intensity is arbitrary units until you normalize • We know that as r goes to 0 ρjk(r) should go to zero so I can be scaled this only works for fixed wavelength • OR for neutrons vanadium scatters incoherently so if you have a piece of vanadium equal in size to your sample it will give you the incident beam spectrum at each angle. Structure of Glass: Section being lectured
Experimental Uncertainty in T(r) The solid and dashed lines represent two data sets for vitreous silica, obtained with different combinations of instrument and approximately 10 years apart. The dotted line gives the difference between the two data sets. Structure of Glass: Section being lectured
Mining the Data • So we take the Intensity data remove background correct and normalize it. • We calculate the interference function then Fourier Transform that (using computational techniques) to the correlation functions…………………………………….then what???? • Lets start with something really simple Structure of Glass: Section being lectured
T(r) from a Neutron Diffraction Experiment Structure of Glass: Section being lectured
Neutron Correlation Function for Vitreous SiO2 The neutron correlation function, T(r), for vitreous silica, showing the extent of the contributions from the order in ranges I, II and III. Structure of Glass: Section being lectured
Range I and II Parameters Range I – parameters include the internal co-ordination number and the distribution of bond lengths and angles. Range II – parameters include the connection mode (corner, edge or face sharing) the connectivity (number of connected structural units) and the distribution of bond and torsion angles. It is in range II that the glass first differs from the crystal. Structure of Glass: Section being lectured
Structural Models of Amorphous Solids 1. Random Network. (a) Hand built. (b) Computer generated. (c) Geometric transformation. 2. Random Coil. 3. Random Sphere Packing. (a) Hand generated. (b) Computer generated. 4. Molecular Model. 5. Crystal Based Models. (a) Limited range of order (finite size). (b) Strained crystal models. 6. Layer model. 7. Amorphous Cluster. 8. Monte Carlo Techniques. (a) Conventional (energy minimisation). (b) Reverse (minimisation of difference from experiment). 9. Molecular Dynamics Simulation. Structure of Glass: Section being lectured
Vitreous Silica Structure of Glass: Section being lectured
Neutron Peak Fit A fit (dashed lines) to the first two peaks in the neutron correlation function,T(r), for vitreous silica (solid line). The dotted line is the residual and the upper curve is the unbroadened fit. The mean Si-O bond length is 1.608 ± 0.004 Å, with an rms deviation of 0.047 ± 0.004 Å, and the mean O-O distance is 2.626 ± 0.006 Å, with an rms deviation of 0.091 ± 0.005 Å. The Si(O) co-ordination number is 4 and the Si-Si contribution is obtained from the corresponding X-ray data. The accuracy of fit is given by the rms R-factor Rc = {i[Texp(ri) – Tfit(ri)]2/iTexp2(ri)}½, which is equal to 0.038. Structure of Glass: Section being lectured
Bond Angle Distribution for Vitreous SiO2 The bond angle distribution, B(b), for vitreous silica obtained by Mozzi and Warren, assuming a random distribution of torsion angles and no correlation between bond and torsion angles. Structure of Glass: Section being lectured
Component Correlation Functions For a sample with n elements there are n(n+1)/2 independent component correlation functions, tij(r) = 4prrij(r); e.g. for vitreous SiO2, the components are Si-Si, Si-O and O-O (O-Si is simply related to Si-O). A single diffraction experiment measures a weighted sum of these components, T(r) = ijwiwjtij'(r), where the i summation is taken over the atoms in the composition unit and that for j over atomic species (elements). For X-rays, the weighting factors, w, are equal to the number of electrons in the given atom/ion, Zi, whereas, for neutrons, w is equal to the neutron scattering length, bi. (The prime on tij'(r) indicates that it is broadened by the peak function, P(r)) Structure of Glass: Section being lectured
Neutron and X-Ray Data for Vitreous As2O3 In the case of vitreous arsenic oxide, the neutron scattering lengths for As and O are very similar (bAs = 0.658×10⁻¹⁴ m; bO = 0.5803 × 10⁻¹⁴ m), whereas arsenic scatters X-rays very much more strongly than oxygen (ZAs = 33; ZO = 8). Hence, for X-rays, the O-O peak is insignificant and the As-As peak is very strong. Structure of Glass: Section being lectured