Download
1 / 6
60 likes | 146 Vues
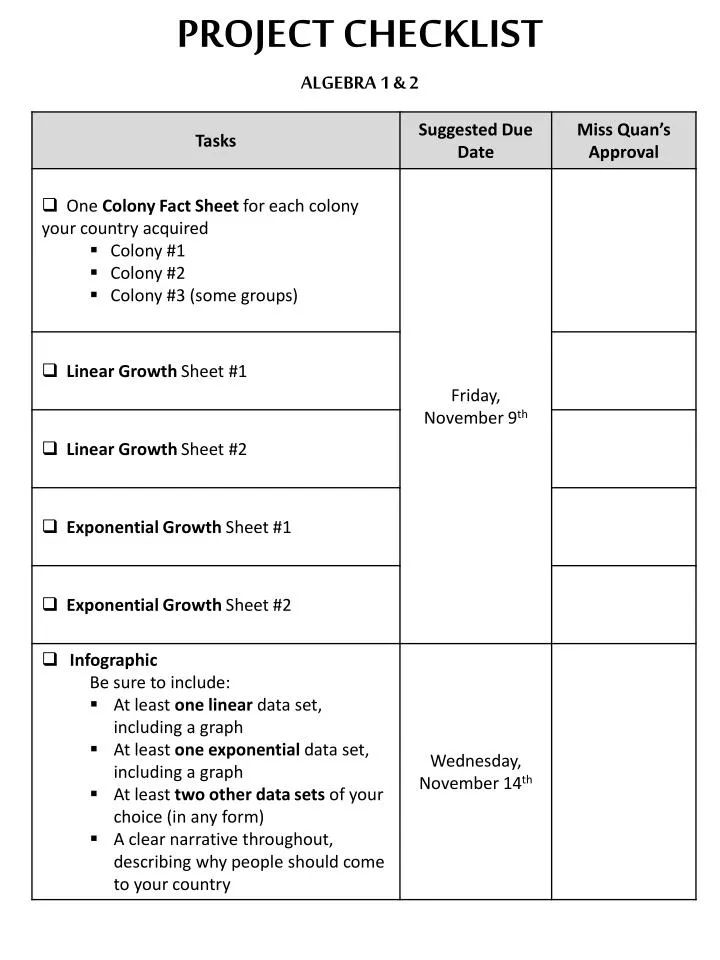
PROJECT CHECKLIST ALGEBRA 1 & 2. COLONY FACT SHEET. Colony Name: _____________________________________. POPULATION DATA. Population: ___________________________________ Population Growth Rate: ________________________ Type of Growth (circle one):. Linear. Exponential.

E N D
COLONY FACT SHEET Colony Name: _____________________________________ POPULATION DATA Population: ___________________________________ Population Growth Rate: ________________________ Type of Growth (circle one): Linear Exponential How could this data be used to attract people to your country? __________________________________________ ____________________________________________________________________________________________________________________________________________________________________________________________________ RESOURCE #1 DATA Resource #1: __________________________________ Initial Production Rate: __________________________ Annual Production Increase: ______________________ Type of Growth (circle one): Linear Exponential How could this data be used to attract people to your country? __________________________________________ _____________________________________________________________________________________________________________________________________________________________________________________________________________________________________________________
RESOURCE #2 DATA Resource #2: __________________________________ Initial Production Rate: __________________________ Annual Production Increase: ______________________ Type of Growth (circle one): Linear Exponential How could this data be used to attract people to your country? __________________________________________ _____________________________________________________________________________________________________________________________________________________________________________________________________________________________________________________ RESOURCE #3 DATA Resource #3: __________________________________ Initial Production Rate: __________________________ Annual Production Increase: ______________________ Type of Growth (circle one): Linear Exponential How could this data be used to attract people to your country? __________________________________________ _____________________________________________________________________________________________________________________________________________________________________________________________________________________________________________________
EXPONENTIAL GROWTH Colony Name: __________________________________ Data for (circle one): Population or Resource Production Initial Value: ________________________________ Growth Rate: _______________________________ Multiplier: _________________________________ Equation: ________________________ y = _____ * ______x initial value multiplier GRAPH DETAILS x-axis independent variable: _________________________________ scale: _______________________________________________ max x-value: _________________________________________ *Be sure to show at least 100 years along the x-axis y-axis dependent variable: _________________________________ scale: _______________________________________________ max y-value: _________________________________________ *Be sure to scale the y-axis to fit the highest output Complete the table with 10 key points that you will use to fill your graph. Make sure you spread them out!
LINEAR GROWTH Colony Name: __________________________________ Data for resource production of: ______________________________ Initial Value: ________________________________ Growth Rate: _______________________________ Equation: ____________________ y = _____ x + ______ growth rate initial value GRAPH DETAILS x-axis independent variable: _________________________________ scale: _______________________________________________ max x-value: _________________________________________ *Be sure to show at least 100 years along the x-axis y-axis dependent variable: _________________________________ scale: _______________________________________________ max y-value: _________________________________________ *Be sure to scale the y-axis to fit the highest output Complete the table with 10 key points that you will use to fill your graph. Make sure you spread them out!
UNITED ATLANTIC KINGDOM… OUR COUNTRY ROCKS! People from all over the world are wanting to come to the United Atlantic Kingdom. And here’s why: Wool production increases by 20 units every year! That means production will be six times greater than the initial value after just 100 years! Lots of WOOLproduction in Exampleland means blankets and sweaters for all! We will have no trouble staying warm in the winter! Units Produced 9 out of 10 people smile EVERY DAY 0 20 40 60 80 100 120 # of years of production 1.7% Somewhat Satisfied 0.5% Dissatisfied 9.7% Mostly Satisfied Growing ExamplelandPOPULATION means a larger workforce and more specialized jobs! According to a recent poll, 88% of UAK inhabitants are completely satisfied with the current government leadership 1.2 % annual increase 50 100 150 200 250 300 350