Download
1 / 18
190 likes | 312 Vues
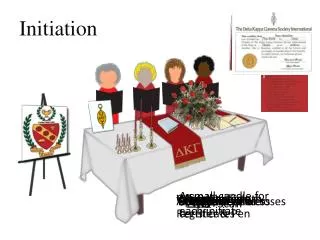
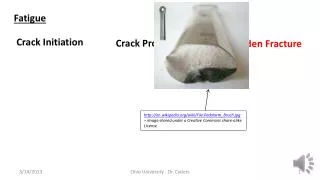
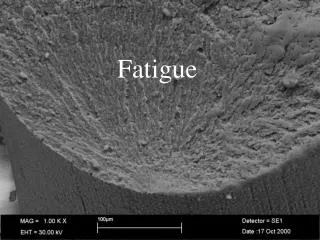
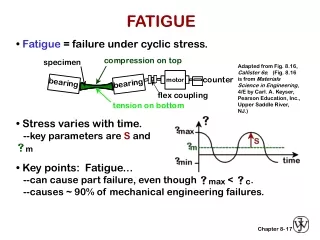
Fatigue Initiation . Makes up some 90% of the total fatigue life Little has been understood about it Experimental fatigue testing of components is very costly. Image - Wikipedia. 3. Oxygen Free High Conductivity Annealed Copper. Initially strain free Simple FCC structure

E N D
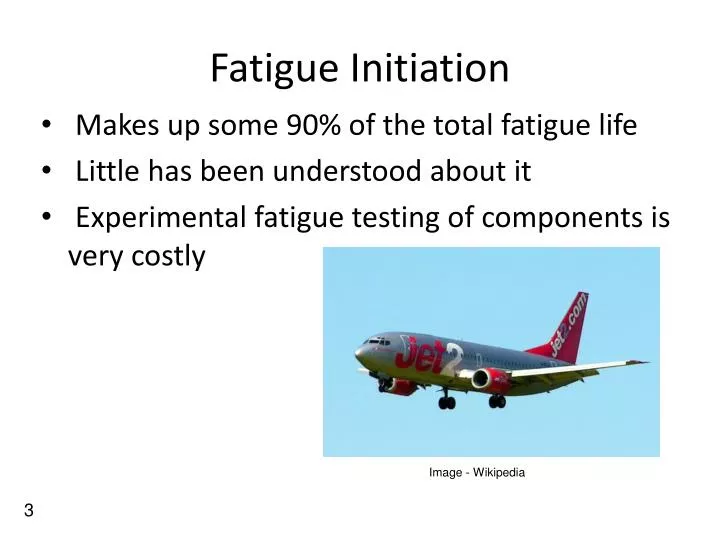
Fatigue Initiation • Makes up some 90% of the total fatigue life • Little has been understood about it • Experimental fatigue testing of components is very costly Image - Wikipedia 3
Oxygen Free High Conductivity Annealed Copper Initially strain free Simple FCC structure Single phase material 99.95+% purity 5
Image of Spray Pattern for Digital Image Correlation 3.3mm 7 3.3mm
Digital Image Correlation Before tensile test After tensile test 8
Vector Map of Pattern Displacements 144 3.3mm 120 Displacement /pixel 9 3.3mm
Cyclic Strain Map for 20Cycles 1.6 0.8 0 10
Cyclic Strain Map for 200 Cycles 1.6 1.6 0.8 0 1.6 0.8 0 1.6 0.8 0 0.8 0 11
Cyclic Strain Map for 2000 Cycles 1.6 0.8 0 12
1.6 Cyclic Strain Maps from Digital Image Correlation 0.8 20 cycles 200 cycles 2000 cycles 0 13 Eyy %
Surface Relief – Appearance of Persistent Slip Bands PSBs PSBs Grain Boundary 14 After 2200 cycles 100μm
Geometrically Necessary Dislocation GND Distribution 200 cycles ρGND 10μm 18
2000 cycles ρGND 10μm 19
0 2 20 200 2000 cycles Scalebar 25μm 16 ρGND 20 12
Project Overview Digital Image Correlation Evolution of surface strain distribution Mechanical testing and empirical lifing Dislocation accumulation High resolution EBSD map Crystal Plasticity Simulation Physical understanding and Improved life prediction 21