Download
1 / 22
220 likes | 374 Vues
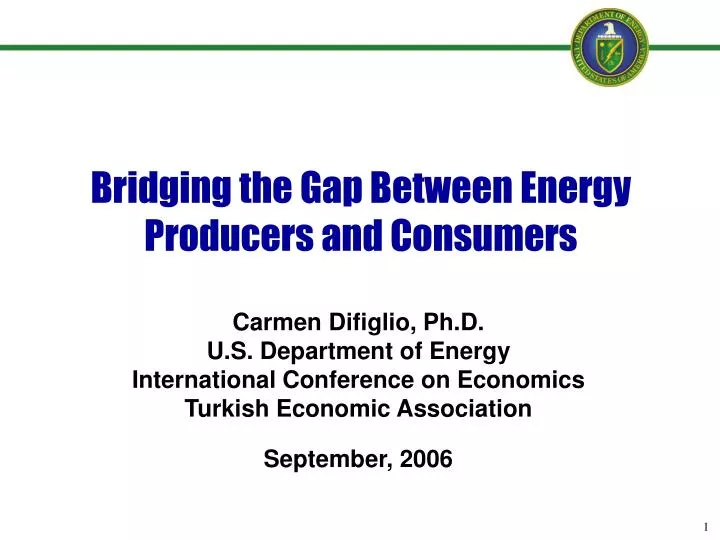
Bridging the Gap Between Energy Producers and Consumers. Carmen Difiglio, Ph.D. U.S. Department of Energy International Conference on Economics Turkish Economic Association September, 2006. Outline of Talk. Problems facing energy producers and consumers.

E N D
Bridging the Gap Between Energy Producers and Consumers Carmen Difiglio, Ph.D. U.S. Department of Energy International Conference on Economics Turkish Economic Association September, 2006
Outline of Talk • Problems facing energy producers and consumers. • Oıl market factors/access to capital. • CO2 emıssıon trends (ıntensıty). • Role of advanced technologıes to reduce CO2 emıssıons. • Technology scenarios. • IEA analysıs used to achıeve a world-wıde perspectıve.
Problems Facing EnergyConsumers • Rising prices. • Uncertain supplıes. • Conflict between economic growth and environment. • Energy security. • Role of government.
Problems Facing EnergyProducers • Uncertainties: • Future markets. • Environmental constraints. • Government policies. • Short-term vs. long-term planning horizon.
7 000 7 000 6 000 6 000 5 000 5 000 4 000 4 000 Mtoe Mtoe 3 000 3 000 2 000 2 000 1 000 1 000 0 0 1970 1970 1980 1980 1990 1990 2000 2000 2010 2010 2020 2020 2030 2030 World Primary Energy Demand(IEA WEO) Oil Natural gas Coal Other renewables Nuclear power Hydro power Fossil fuels account for almost 90% of the growth in energy demand between now and 2030
6 000 share of total increase (%) 85% 5 000 4 000 59% 3 000 Mtoe 2 000 31% 12% 1 000 10% 3% 0 1971-2002 2002-2030 OECD Transition economies Developing countries Increase in World Primary Energy Production by Region (IEA WEO) Almost all the increase in production to 2030 occurs outside the OECD
Access to Oıl • Future oıl supplıes are ıncreasıngly not dıctated by market forces but by government polıcıes. • This partly reflects exercıse of monopoly power but also can reflect natıonal polıcıes that are not as self servıng. • Access of foreıgn capıtal can ımprove productıvıty, reduce waste and envıronmental damage assocıated wıth energy productıon.
Iraq 10% National companies only (Saudi Arabia, Kuwait, Mexico) Concession 35% 21% Limited access - Production National sharing companies 12% 22% Access to Oil Reserves (IEA WEO) 1,032 billion barrels Access to much of the world’s remaining oil reserves is restricted
Number of New Wells Drilled in 1995-2003 24 500 fields Middle East Former Soviet Union North America Europe Africa, Latin America and Asia Undiscovered Oil & Gas Resources & Exploration Wells Drilled, 1995-2003 (IEA WEO) Undiscovered Oil & Gas Resources 1.9 trillion boe Discoveries have fallen in recent year, mainly because exploration has shifted to less prospective regions
Environment • Pollution vs Climate-Changing Emissions • Reducing pollution (sulfur, NOx, VOCs, PM) has tangible benefits that are easily recognized. Local actors receive the benefits. • Reducing climate-changing emissions (CO2, methane, etc.) has less tangible benefits. Benefits accrue to non-actors in non-predictable ways. • While substantial progress has been made to produce and use energy without pollution, climate-changing emissions are much more difficult problem.
Technology Opportunitiesand Limits • Clean energy technologies can provide more secure energy services but do not always represent a good business investment. • It is usually more profitable to produce energy than to save energy. • Without government support, there is little incentive for industry to commercialize uncompetitive technologies with the goal of making them competitive through technology learning.
World Energy-Related CO2 Emissions(IEA WEO) Global emissions grow 62% between 2002 & 2030, and developing countries’ emissions will overtake OECD’s in the 2020s
Primary energy demand CO2 Emissions Growth in World Energy Demand and CO2 Emissions (IEA WEO) 2.5% 2.0% 1.5% average annual growth rate 1.0% 0.5% 0.0% 1971-2002 2002-2030 Average carbon content of primary energy increases slightly through 2030 – in contrast to past trends
IEA’sEnergy Technology Perspectives • 2006 Publication of the International Energy Agency. • Provides status of energy technologies that can reduce provide energy service demand while reducing CO2 emissions. • Using the Energy Technology Perspectives model, provides scenarios of technology use through 2050. • Assumes upper limit of $25 USD/tonne CO2 (incremental cost to achieve emission reduction).
Scenarios (IEA ETP) • Baseline • ACT Map = achieves expected success in all technology areas with government efforts and CO2 reduction incentives. • No CO2 capture and storage scenario. • Low • efficiency, • renewables, & • nuclear scenarios. • TECH = high success in all technology areas.
Contribution of Technologies to CO2 Emissions Reduction – 2050(IEA ETP)
Emission Reduction among OECD, Transition and Developing Countries (IEA ETP)
Key FindingsEnergy Technology Perspectives • Most energy still comes from fossil fuels in 2050. • CO2 emissions can be returned towards today’s level by 2050. • Growth in oil and electricity demand can be halved. • Power generation can be substantially de-carbonised by 2050. • De-carbonising transport will take longer but must be achieved in the second half of the century.
Policy MessagesEnergy Technology Perspectives • Improving end-use energy efficiency is top priority. • Well-focused R&D is essential. • Tech R&D to deployment incentives are critical. • Stable policy environment needed that promotes low carbon technologies and also address non-economic barriers. • Collaboration among developed & less-developed countries is essential.