Download
1 / 23
230 likes | 343 Vues
State of Israel Ministry of Industry, Trade & Labour. Diamonds, Precious Stones and Jewelry Administration. Research & Economic Administration. Jewelry Put into Numbers. Heading towards the Jovella Exhibition. July 9, 2007. Jewelry Put into Numbers. Introduction and Key Findings

E N D
State of Israel Ministry of Industry, Trade & Labour Diamonds, Precious Stones and Jewelry Administration Research & Economic Administration Jewelry Put into Numbers Heading towards the Jovella Exhibition July 9, 2007
Jewelry Put into Numbers Introduction and Key Findings The Jewelry Industry in Israel Household Jewelry Expenses Jewelry Purchase by Women, Special Survey We would like to thank Howard Ross, Michal Bar’el, Sigal Shidlovski, Merav Grinshtein. Moshe Meitar and Idit Mordechai for their analysis, writing, statistical processing and graphic design of this publication.
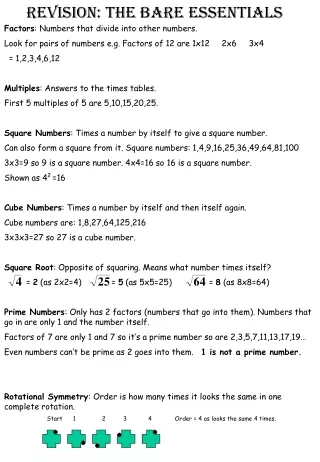
Introduction and Key Findings Introduction Jewels have been used by man as decorative accessories since the dawn of time. The value and uniqueness of a jewel are usually determined according to the raw material it is made from, its rareness and the level of craftsmanship put into it. In ancient times, man created jewelry out of wood, ivory, clams and bones. In later times, the materials used for making jewelry became costlier: metals, such as gold, silver and platinum, and also precious stones, such as diamonds, agates and others. In the past, jewelry (and other items) were used as a means of payment for goods and services. In our age, jewelry is a luxury product and its significance goes beyond its primary decorative purpose: a jewel can serve as a symbol of status and social attribution, a means for accumulating possessions, an expression of art-work, etc. In that light, the fact that jewelry carries a considerable ceremonial significance in different cultures is not surprising at all; it symbolizes marriage and engagement, as well as tribal affiliation, and is regarded in many places as “lucky stones” with extraordinary properties or as a talisman providing protection from evil spirits and such. The information in this publication is divided into three chapters1): The jewelry industry, household jewelry expenses and jewelry purchase by women (special survey). The statistical data in the different chapters was gathered from the following sources: Jewelry industry – A special processing of data from the “Industry Indices – Compilation of Statistical Findings”, published by the Central Bureau of Statistics” in 1985, 1990, 1995, 2000 and 2005. Household jewelry expenses – Key findings of the “Survey of Household Expenses, 2005”, that includes the total amounts spent by households on goods or services, including jewelry 2). Jewelry purchase by women - Key findings of a special survey, conducted by the Economic Planning Administration and the Diamonds, Precious Stones and Jewelry Administration of the Ministry of Industry, Trade & Labor. 1) Data in the three chapters is taken from different sources. Therefore, data from different chapters should not be crossed and compared, since it is based on different population samples. 2) Data of the Central Bureau of Statistics is based on jewelry and watches bought for more than 100 NIS per item.
A joint survey of the Economic Planning Administration and the Diamonds, Precious Stones and Jewelry Administration was conducted throughout April-May 2007. The survey included a statistical sample of about a thousand women over the age of 18 who had purchased jewelry in the course of last year3). The purpose of this survey was to create a basic data infrastructure, depicting jewelry purchase trends, seasonality and jewelry purchase scales; a valuable infrastructure – unavailable until now – for decision- makers in the Ministry of Industry, Trade & Labor, as well as for manufacturers and other businessmen in this field. The main tool used for data capture was a designated questionnaire, conducted via the telephone. The questionnaire covered the following issues: * Demographic information: Who are the women who buy jewelry and how is their behavior influenced by various socio-demographic factors? What are the preferences of target audiences and sub-groups in the jewelry consumption market? * Consumer behavior: What are the main characteristics of women who purchase jewelry? Do women buy jewelry for themselves or as a present for others? Where do they buy jewelry? Why do they prefer a certain jewelry store over another? What are the popular purchase channels? Etc. * Psychological aspects: What are the key factors that motivate consumers to take a decision regarding jewelry purchase? How can jewelry manufacturers and sellers understand better what’s going on inside the heads of their women target market? How does exposure to commercials influence purchase tendencies? What are the attitudes regarding different features of jewelry products? Etc. At the same time, the survey tracks the different characteristics of women who buy jewelry in Israel, mapping and enriching knowledge based on various consumption aspects. The findings of this survey are of significance for jewelry retailers who compete in this market, as well as for whoever is intending to enter this market in the future. In addition, the survey presents information and insights that can assist members of the jewelry industry in their day-to-day activities and planning of future steps in this field. This publication summarizes the key findings out of the three data sources mentioned above regarding the jewelry industry, household jewelry expenses and patterns of jewelry purchase by women 3) Survey sampled 2000 women, out of which 49% (about a thousand women) reported that they had purchased jewelry in the course of that year; they were the ones who actually answered the questionnaire. Survey included only women, since they are the main consumers of jewelry – either buying jewelry themselves or having it purchased for them.
Key Findings: • The Jewelry Industry in Israel 4), 2005: • The jewelry industry, regarded as a traditional industry, is amongst the oldest industries in Israel. In 2005, total number of employees in the jewelry industry was 3,745 and industrial export summed up to 489 million dollars (out of which 70% came from gold jewelry). • The jewelry industry in Israel is characterized by having relatively small-sized factories and many small workshops. In 2005, the average number of employees per factory was only ten, and most factories’ (84%) turnover was less than 5 million NIS. In addition, more than half (53%) of the total yearly turnover comes form only 3% of the total number of factories. • The relative weight of the jewelry industry in Israel’s total industrial export is between twice to four times higher than its relative weight in Israel’s total industrial turnover. In view of that, the industry’s production is predominantly destined for foreign markets. • The jewelry industry in Israel experienced a slowdown between the years 1995-2005, expressed in three key factors: A decrease in the industry’s number of employees, and a decrease in the industry’s relative weight in Israel’s total industrial export and total industrial turnover. • Household Jewelry Expenses, 2005: • In 2005, 16% of total household in Israel (312,000 households) purchased jewelry. Their total yearly expenditure on Jewelry was 950 million NIS, 47% higher than the 645 million NIS that were spent on purchasing jewelry in 1997. • A household (that purchased jewelry) spends 1.7% of its total monthly expenses on jewelry. • Households’ Average monthly expenditure on jewelry was 254 NIS5). It varied according to household’s socio-demographic factors 6), as follows: • - Muslims spent an average of 442 NIS per month on jewelry – about twice as high as what Jewish, Christian and Druze households spent. • - Average monthly expenditure on jewelry among native Jewish population7) was 241 NIS, compared to 194 NIS among new Jewish immigrants (who had arrived in Israel after 1990). • - Average monthly expenditure on jewelry among population with an educational background of 16 years and more was the highest – 300 NIS, compared to 200 NIS among population with less than 12 years of education. 4) According to the Central Bureau of Statistics, the jewelry industry includes gold-work, silver-work and production of decorative jewelry items; the diamond industry is not part of it. 5) These figures refer only to households who had purchased jewelry. 6) Socio-Demographic factors were determined according to head of household. 7) Native Israelis or long-time immigrants from before 1990.
- No significant differences in jewelry expenses were found between different age groups, although population under 34 years old, spent, on average, a bit more than the other age groups – 271 NIS per month. • Households with an average monthly income of less than 6,500 NIS8), spent on average 134 NIS on jewelry; less than half the amount spent on jewelry by households with an average income of over 6,500 NIS. • Jewelry Purchase by Women 9), special survey – 2007: • 49% of women bought jewelry during the course of the year (about 1.2 million women10). • Most jewels that were bought are relatively cheap; about 60% of jewelry was bought for less than 200 NIS, and only 5% was purchased for an amount of over 2000 NIS. The relatively small amounts paid for jewelry might explain the survey’s finding that women usually don’t compare between jewelry prices and are not aware of relevant sales. Only 24% of women who had bought jewelry last year reported that they regularly or usually compare prices, and only 13% reported that they usually follow jewelry sales. • Average jewelry item price was 573 NIS. The most expensive items were rings11) (907 NIS per item on average), followed significantly behind by bracelets (683 NIS) and necklaces (589 NIS). Finally, the cheapest of all items were the earrings, with an average price of only 283 NIS per item. • The most common place for buying jewelry is a non-chain jewelry store. 37% of jewelry was purchased there, compared to 23% that was bought in chains. Other places in which women had bought jewelry were: private non-chain stand (15%), direct purchase from a jewelry designer (6%), clothes or fashion stores (5%) and department stores (4%). • Key reasons for purchasing jewelry in a particular store or chain were store’s credibility and quality of its jewelry. These two reasons were mentioned by 52% of women as the key reason for choosing a particular place for jewelry purchase. • The most popular item of jewelry is the necklace – 72% of women, who had purchased jewelry last year, had bought at least one necklace. Average yearly expenditure on necklaces was 650 NIS, which was about 38% of total yearly expenses on jewelry. The second most popular jewel was earrings: 62% of women had bought at least one pair. However, average yearly expenditure on earrings was about 240 NIS (14%). Rings and bracelets are less popular, but yearly average expenditure on rings was quite high (about 500 NIS), which is 2% of total annual expenses on jewelry. 8) Including all sources of household income. Taken from the “households’ expenses survey”, conducted by the Central Bureau of Statistics in 2005. 9) Data regarding jewelry item price, place of purchase, type of product, person for which jewel is bought and reason for purchase, is based on the answers of women who had bought 1-4 jewelry items in the course of last year. In cases of more than 5 items, data was included as well. 10) Number was estimated out of the total population of women over 18 years of age in Israel (taken from a manpower survey of the Central Bureau of Statistics, 2005). 11) Not including engagement or wedding rings bought by women for themselves or for their spouses.
The main reason for preferring a certain jewel over another was the jewel’s design. More than half of the women (53%) mentioned it as the main guiding factor when choosing a jewel. • About one third (30%) of total jewelry items bought is “fashion jewelry”12); another one third (29%) is jewelry made of gold; about one quarter (23%) is jewelry made of silver and the rest is jewelry made of mixed raw materials (including diamonds and precious stones), that were not bought as often. However, one difference was found in choice of product type according to the purpose for which it is bought: Gold jewelry is more popular for presents, while “fashion jewelry” is more popular when buying for oneself. • 69% of jewelry purchased by women was for their own use, 21% for family members and only 10% for their spouses or friends. In addition, most jewelry (58%) was bought with no connection to a specific special event. The most common occasion mentioned in relation to jewelry purchase was birthdays (24%). • - 69% of women who had purchased jewelry are native Israeli Jews, 11% are new Jewish immigrants and 19% are Arabs 13). Average yearly expenditure on Jewelry among Arab women was 2,680 NIS. Veteran Israeli Jewish women, in comparison, spent only 1,426 NIS on average. • - 69% of women who had purchased jewelry are married, 24% are single and 6% are either widowed or divorced. Average yearly expenditure on Jewelry among married women was 1,950 NIS. Single women, in comparison, had only spent 1,222 NIS on average. • Women aged 45-54 spent the highest amount per jewelry item (740 NIS on average); compared to women aged 18-24, who had only spent 433 NIS on average. • - Distribution of women who purchased jewelry across different income groups14) is quite homogenous (meaning that there is no significant difference in the number of women buying jewelry among the different income groups). However, among women with a household income of more than 10,000 NIS, the average yearly expenditure on jewelry was 2,747 NIS, compared to 1,500 NIS in households with an income of less than the above amount. • - 69% of total women who had purchased jewelry were working women, and their yearly expenditure was 1,862 NIS on average. The remaining 31% were non- working women, with a yearly jewelry expenditure of only 1,477 NIS. • - About half of the women who had purchased jewelry are secular, about quarter of them are traditional and the rest are religious (14%) and religious orthodox (10%). Yearly expenditure of secular women was 1,535 NIS on average, compared to a yearly expenditure of only 873 NIS on average among religious women. 12) “Fashion Jewelry”– Jewelry that is principally made out of inexpensive materials, such as beads, plain stones, plastic, etc. 13) New Jewish Immigrants – after 1990. Arab Women – including Muslims, Christians and Druze. 14) Income groups include: less than 6,500 NIS, 6,501-10,000 NIS and more than 10,001 NIS per household.
- In addition to the jewelry that the women had bought themselves, 32% of women reported that in the course of the previous year they had received jewelry as a present from one of their family members. Cost of these additional presents, in addition to their annual average expenditure on jewelry, was over 2,000 NIS 15) on average. 15) About half of women who had received jewelry as a gift, did not know or did not want to disclose the total cost of the jewelry, Therefore, the amount written is based only on the answers of women who did report the total cost.
The Jewelry Industry 16 in Israel Data from Industry Indices, 2005 Number of Factories 218 Number of Employees 3,745 Total Jewelry Turnover m517$ 0.8% Proportion of Jewelry Industry Turnover to Israel’s Total Industrial Turnover Total Jewelry Export m489$ Export of Gold Jewelry m337$ Proportion of Jewelry Industry Export to Israel’s Total Industrial Export 17 1.9% 16) The jewelry industry includes gold jewelry, silver jewelry and production of decorative jewelry items. The diamond industry is not part of it. 17) Total excluding diamonds.
Chart 1 -Factories’ Distribution according to Turnover Volume 25-50 million NIS 2% 10-25 million NIS 4% Over 50 million NIS 3% 5-10 million NIS 7% 100% Under 5 million NIS 84% Chart 2 - Factories’ Distribution according to Turnover Volume And Contribution to Industry’s Total Employment and Turnover Annual Turnover Under 5 million NIS 5-10 million NIS 10-25 million NIS 25-50 million NIS Over 50 million NIS Relative contribution to Industry’s Total Employment Relative contribution to Industry’s Total Turnover
Chart 3 -Average Number of Employees according to Turnover Volume Number of Employees Average number of employees per factory – 10 ממוצע עובדים למפעל - 10 Yearly Turnover In millions of NIS Chart 4 - The Jewelry Industry’s Turnover, 1985 - 2005 Turnover in millions of current dollars Relative weight of industry in total industrial turnover Million of dollars
Chart 5 -Number and Proportion of Employees in the Jewelry Industry, 1985 - 2005 Number of Employees Employees in jewelry industry out of Israel’s total industry employees Number of Employees Chart 6 - Jewelry Industry - Export, 1985 - 2005 Export in millions of current dollars Relative weight of industry in Israel’s total industrial export Million of dollars
Household Jewelry Expenses 18 Data from Household Expenses Survey, 2005 19 Total households that purchased Jewelry 312,000 950 million Total yearly households’ expenditure on Jewelry, in NIS Average monthly expenditure on Jewelry Per household 254 NIS Proportion of households that had purchased Jewelry 16% Proportion of Jewelry expenditure out of households’ total monthly expenditure 1.7% 18) Data is taken from the Central Bureau of Statistics survey of household expenses. The data refers to both jewelry and watches bought for more than a 100 NIS per item. 19) Data refers only to households who had purchased jewelry during 2005.
Chart 7 - Jewelry Expenditure per Population Sector Average monthly expenditure Proportion of buyers from this sector NIS NIS 442 NIS 234 NIS 196 NIS 191 Jews Muslims Druze Christians Chart 8 - Jewelry Expenditure according to native / immigrant population Average monthly expenditure Proportion of buyers in population group NIS Native Israeli Immigrated after 1990 * Data in this chart refers only to Jews. Origin is determined according to the head of the household. * “Native Israeli” – Including long-time immigrants from before 1990.
Average monthly expenditure Proportion of buyers in population group Average monthly expenditure Proportion of buyers in population group Chart 9 - Jewelry Expenditure according to Educational Background NIS Years of education * Level of education was determined according to the head of the household. Chart 10 - Jewelry Expenditure according to Age NIS 271 NIS 257 NIS 252 NIS 236 NIS Age * Age was determined according to the head of the household.
Average monthly expenditure Proportion of buyers in population group Chart 11- Jewelry Expenditure according to Household’s Income 361 NIS 303 NIS 219 NIS 134 NIS NIS * Including all sources of household income. Data is taken from the Central Bureau of Statistics survey of household expenses, 2005.
Jewelry Purchase by Women Data from special survey, 2007 The Economic Planning Administration 49% of women purchased jewelry in the course of last year (1.2 million Women) 20 Women had bought on average 5.2 jewelry items per year. 69% of jewelry bought by women was for their own use. 58% of jewelry was purchased with no connection to any special occasion, and only 42% were bought for events such as birthdays, holidays, etc. 37% of Jewelry was bought in non-chain jewelry stores. 20) Figure was estimated out of the total population of women in Israel over the age of 18 (taken from the Central Bureau of Statistics survey of household expenses, 2005). * Charts 12-14, 16 and 18-19 are based on the answers of women who had bought 1-4 jewelry items in the course of last year. In cases of more than 5 items, data was included as well.
Chart 12 - Expenditure Distribution for a Single Jewelry Item Proportion Average price per jewelry item 573 NIS NIS Chart 13 - Distribution of Jewelry Expenditure by Women According to Jewelry Type Earrings - 14% Necklace - 38% 100% Ring - 29% Bracelet - 19% * Necklace expenditure includes 2% spent on other jewelry items such as pins and medallions.
Chart 14 - Where do Women Shop for Jewelry? T.V / Internet Shopping Channel Jewelry Factory Duty Free Diamond Bourse Agent / Salesman Department Store Clothes or Fashion Stores Direct Purchase from a Jewelry Designer Non-chain Private Stand Jewelry Chain Stores Non-chain Jewelry Store * Does not add up to 100% due to other shopping location, not included in the chart, such as gift shops and cosmetics stores. Chart 15 - Key Reasons for Choosing a Particular Jewelry Store Level of comfort in purchase 3% Possibility of item replacement / refund 3% Possibility of a “tailored order” 3% A well-known and experienced store or chain 3% Selection of jewelry 19% Location inside a shopping mall 2% 100% Quality of Jewelry 26% Store’s credibility 27% Low prices compared to other stores 15% * Question referred to choice of a jewelry store or chain.
Chart 16 - Distribution of Jewelry Purchase according to Product Type Fashion Jewelry 30% Gold 29% 100% Gold embedded with diamond/s 3% Gold embedded with precious stones 4% Silver 23% Silver embedded with precious stones 7% Combination of silver and gold 4% * “Fashion Jewelry”– is jewelry that is principally made out of inexpensive materials, such as beads, plain stones, plastic, etc. Chart 17 - Key Reasons for Choosing a Particular Jewelry Item Hand-made jewel 1% A comfortable-to-wear jewel 6% A jewel that would last for a long time 2% A jewel that is currently fashionable 4% Jewel’s Price 6% Investment 2% Jewel’s Design 53% 100% Jewel’s Uniqueness 12% Jewel’s Quality 15%
Chart 18 - Why Do Women Buy Jewelry? For Mother’s Day 1% For the Holidays 5% For a Wedding Anniversary 1% For a Birthday 24% 100% With no-connection to any special event 58% For a New Birth 1% For Marriage, Engagement* 8% For a Bar/Bat Mitzvah 2% * Not including engagement or wedding rings bought by women for themselves or for their spouses. Chart 19 - For Whom Do Women Buy Jewelry? For friends 6% For family members 21% For themselves 69% 100% For their spouse 4% * Calculated from total jewelry purchases, meaning: 69% out of jewelry purchased by women in the course of last year were bought for their own use.
Chart 20 - Proportion of Jewelry Purchase by Women According to Jewelry Type Bracelet Ring Earrings Necklace * Total women who had bought specific item last year (out of the total number of women who had bought jewelry items).
Jewelry Purchase by Women – Socio-Demographic features 1) The total yearly expenditure was detailed by 86% of women who had purchased jewelry. This expenditure includes jewelry bought by women for other people, but does not include jewelry that women had received as gifts. 2) Arabs – including Muslims, Christians and Druze. 3) Total monthly income from all sources of the entire family.