Download
1 / 20
210 likes | 416 Vues
Non-parametric equivalents to the t-test. Sam Cromie. Parametric assumptions. Normal distribution (Kolmogorov-Smirnov test) For between groups designs homogeneity of variance (Levene’s test) Data must be of interval quality or above. Scales of measurement - NOIR. Nominal

E N D
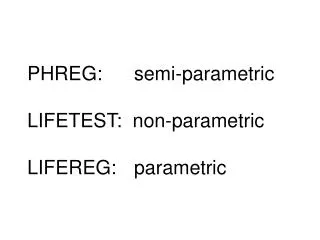
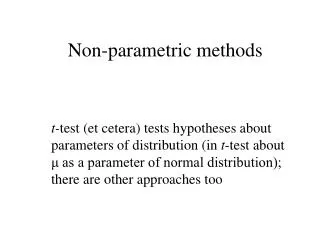
Non-parametric equivalents to the t-test Sam Cromie
Parametric assumptions • Normal distribution • (Kolmogorov-Smirnov test) • For between groups designs homogeneity of variance • (Levene’s test) • Data must be of interval quality or above
Scales of measurement - NOIR • Nominal • Label that is attached to someone or something • Can be arbitrary or have meaning e.g., number on a football shirt as opposed to gender • Has no numerical meaning • Ordinal • Organised in magnitude according to some variable e.g., place in class, world ranking • Tells us nothing about the distance between adjacent scores
Scales of measurement - NOIR • Interval • adjacent data points are separated by equivalent amounts e.g., going from an IQ of 100 to 110 is the same increase as going from 110-120 • Ratio data • adjacent data points are separated by the same amount but the scales also has an absolute zero e.g., height or weight • When we talk about attractiveness on a scale of 0-5, 0 does not mean that the person has zero attractiveness it means we cannot measure it • Psychological data is rarely of ratio quality
What type of scale? • Education level • County of Birth • Reaction time • IQ
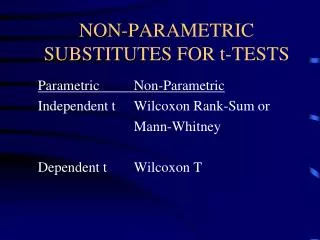
Between groups design • Non-parametric equivalent = Mann-Whitney U-test
Group A Scores Group B Scores 7, 10, 10, 12 3, 4, 4, 9 Mann-Whitney U-test • Based on ordinal data • If differences exist scores in one group should be larger than in the other
Rank ordering the data • Scores must be combined and rank ordered to carry out the analysis e.g., Original scores: 3 4 47910 10 12 Ordinal scores: 1 2 3456 7 8 Final Ranks: 1 2.5 2.5456.5 6.5 8 • If there is a difference, scores for one group should be concentrated at one end (e.g., end which represents a high score) while the scores for the second group are concentrated at the other end
Null hypothesis • H0: There is no tendency for ranks in one treatment condition to be systematically higher or lower than the ranks in the other treatment condition. • Could also be thought of as • Mean rank for inds in the first treatment is the same as the mean rank for the inds in the second treatment • Less accurate since average rank is not calculated
Calculation • For each data point, need to identify how many data points in the other group have a largerrank order • Sum these for each group - referred to as U scores • As difference between two Gs increases so the difference between these two sum scores (U values) increases
Determining significance • Mann-Whitney U value = the smaller of the two U values calculated - here it is 1 • With the specified n for each group you can look up a value of U which your result should be equal toor lower than to be considered sig
Note extremes… • At the extreme there should be no overlap and therefore the Mann-Whitney U value should be = 0 • As the two groups become more alike then the ranks begin to intermix and U becomes larger
Reporting the result • Critical U = 0 • Critical value is dependent on n for each group • U=1 (n=4,4), p>.05, two tailed
Formula for calculation • Previous process can be tedious and therefore using a formula is more ‘straight forward’
Repeated measures - Wilcoxon T • H0 = In the general population there is no tendency for the signs of the difference scores to be systematically positive or negative. There is no difference between the means. • H1= the difference scores are systematically positive or negative. There is a difference between the means.
-1 +18 +7 -8 T=5 Table showing calculation • Calculate difference score • Assign rank independent of sign • Add ranks for each sign separately • T = lowest rank total +25 6 +5 2 1 5 3 4 16 5
Interpreting results • Look up the critical value of T • You result must be equal toor lowerthan it in order to be considered significant • With n = 6 critical T is 0 and therefore the result here is not significant. • As either sum of ranks approaches 0 the presence of that direction of change is limited • If the sum of negative ranks is small there are obviously very few decreases indicating that most scores increased
Non-parametric Pros and Cons • Advantages of non-parametric tests • Shape of the underlying distribution is irrelevant - does not have to be normal • Large outliers have no effect • Can be used with data of ordinal quality • Disadvantages • Less Power - less likely to reject H0 • Reduced analytical sophistication. With nonparametric tests there are not as many options available for analysing your data • Inappropriate to use with lots of tied ranks