Download
1 / 39
390 likes | 546 Vues
An Introduction to the 2005-2009 American Community Survey 5-Year Data Release. Webinar: December 8, 2010 Release Day: December 14, 2010 Call-in Information Toll free number: 800-369-6091 Participant passcode : CENSUS. Introductions. Frank Ambrose

E N D
An Introduction to the 2005-2009 American Community Survey 5-Year Data Release Webinar: December 8, 2010 Release Day: December 14, 2010 Call-in Information Toll free number: 800-369-6091 Participant passcode: CENSUS
Introductions • Frank Ambrose Chief, State and Governmental Programs Branch, Customer Liaison and Marketing Services Office • Sharon Stern Assistant Division Chief, Project Coordination, Communication, and Data User Support, ACS Office • Scott Boggess Chief, ACS Coordination Staff, Housing and Household Economic Statistics Division
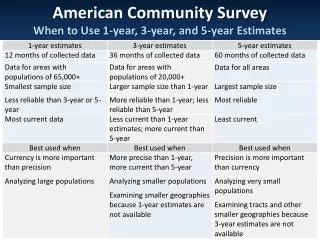
Measuring America • American Community Survey • Sept. 28: 2009 1 Year Estimates • Dec. 14: 2005-2009 5-Year Estimates • Jan.: 2007-2009 3-Year Estimates • Jan.: 2005-2009 5-Year PUMS files (public use microdata files) • 2010 Census • By Dec. 31: 2010 Census Apportionment Counts • Feb. – March: State and Local Level Data • 2010 Census Results Released Throughout 2011 and beyond • Demographic Analysis • Dec. 6
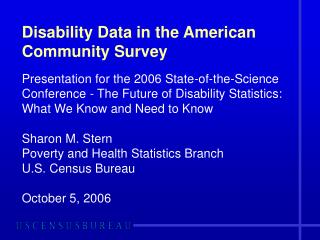
What is the ACS? A large, continuous survey that: • samples approximately 3 million addresses per year • produces characteristics of population and housing • produces estimates for small areas and small population groups
ACS is Part of the 2010 Decennial Census Program Focus the 2010 Census and future decennial censuses on improving the population count and collecting only basic characteristics Eliminate the long form and implement the ACS to provide detailed characteristic data more than once every ten years
ACS Estimates Are NOT the 2010 Census Population Counts The 2010 Census counts the population to support apportionment and redistricting. The ACS supplements this information with annually updated data on the nation’s population and housing characteristics. The purpose of the ACS is not to count every person in a community or town but rather, to provide a portrait of the community’s characteristics.
History of the ACS First data released for nation and areas 250,000+ First 5-yr. est. released for areas of all sizes First 3-yr. est. released for areas more than 20,000 First 1-yr est. released for areas more than 65,000 Demonstation Period: evaluated operational feasibility and survey quality Expanded to full sample of HUs in all counties in 50 states, DC & PR GQs added Implemented new and modified content to meet emerging need.
Content of the ACS More than 30 Federal agencies participate in the Interagency Committee for the ACS which provides oversight for the content of the survey. As part of the decennial census program, survey content is limited to those measures required by Federal agencies
Housing Chatacteristics Housing Value Utilities Social Characteristics Education Language Spoken at Home Economic Characteristics Income Occupation Demographic Characteristics ACS Topics
ACS Topics Meeting the Needhttp://www.census.gov/acs/www/about_the_survey/american_community_survey/ • More than $400 billion dollars are allocated based on Census data, including the ACS • Even more agencies need the data for planning and evaluation • Example: Under the Voting Rights Act, data on languages spoken at home are needed to assess the fairness of voting practices in governmental subdivisions.
Period Estimates • The estimates are NOT an average of 1-year estimates • Describe the average characteristics over a specific period of time • Period estimates do not represent a single point in time • Period is • 1 year (12 months) • 3 years (36 month) • 5 years (60 months)
ACS Data Dissemination: 1-Year, 3-Year, and 5-Year Estimates
ACS 1-Year Estimates Available for Counties with Populations 65,000 or more http://www.census.gov/acs/www/data_documentation/reference_maps/ http://www.census.gov/acs/www/data_documentation/reference_maps/
All Geographies Availablehttp://www.census.gov/acs/www/data_documentation/geography/
Sample Period Estimates: Percentage of People 5 years and older Speaking Only English at HomeRockland County, NY Source: U.S. Census Bureau, 2005 through 2009 American Community Surveys
Characteristic with year-to-year increases * Artificial data for illustrative purposes only.
Characteristic with annual fluctuations (increases and decreases) * Artificial data for illustrative purposes only.
Characteristic with little change over time * Artificial data for illustrative purposes only.
Details on the 5-year releaseWhat is included? Types of Tables Text Files Summary files Public Use Microdata Sample (PUMS) files • Detailed tables • Data profiles • Narrative profiles • Subject tables • Geographic comparison tables Available now: 5-year Data Product Preview Page
Check out the details onlinehttp://www.census.gov/acs/www/data_documentation/2009_5yr_data/
Details on the 5-year releaseHow do I download the tables? • American FactFinder’s familiar tools. • View on screen then choose to download to a presentation format or a database compatible format. • Go directly to the AFF Download Center to select tables and geographies, then download text files • Tables not included on AFF • Pre-packaged in “summary files” for download • Select tables available on the FTP site in .csv format • Technical documentation will be available for experienced users to download and read the files with statistical software • Select tools will be available to assist less experienced users
12/14/2010Where do I find the tables? • First Stop: American FactFinder • Second Stop: ACS 5-Year Data Page • Some tables are available on the FTP site as comma delimited .csv files • All estimates are available in summary files • ACS website will tell you where to go
Strength of the ACS • Produces reliable characteristic estimates for geographies and subpopulations • The ACS generally does a better job estimating percents, rates, means, and medians than it does totals
Making Comparisons • The ACS facilitates comparisons across geographies or subpopulations for the same survey period • Users should not mix 1-year, 3-year, and 5-year ACS estimates when making comparisons • The ACS and the Census 2000 sample survey are different surveys, estimates from the two are not always comparable
Guidance on Comparing 2005-2009 ACS and Census 2000 • Quick Guide – Simple topic by topic recommendations for making comparisons; what you SHOULD do • Comparison Guidance – More detailed explanation of how differences in the two surveys impact comparability • Table Comparison Tool – Helps you locate comparable ACS and Census 2000 Detailed Tables
Comparing Across Geographies • The 5-year ACS release includes two products to help users make comparisons across geographies • Geographic Comparison Tables (GCTs) • Thematic Maps • 72 different characteristics • Can compare across States, Counties, Places, Metropolitan and Micropolitan Statistical Areas, Combined Statistical Areas, Congressional Districts, Urban/Rural Areas, Urbanized Areas, PUMAs, School Districts, and American Indian Areas/Alaska Native Areas/Hawaiian Homelands/Alaska Native Regional Corporations
County Map pdfs • To assist you in working with the data we produced several high-quality, county-level maps for both the 2005-2009 ACS and Census 2000 • These maps are higher resolution versions of the Thematic Maps on American FactFinder • Unlike the pdf maps, the Thematic Maps are customizable
Quality of ACS Estimates Recent research suggests that margins of error around ACS 5-year estimates will be about 1.75 times as large as those associated with the Census 2000 sample estimates Evaluations after Census 2000 demonstrated reductions in ACS nonsampling error relative to Census 2000
Margins of Error and Data Filtering • We do not perform any data quality filtering for the 5-year ACS estimates • Check margins of error to ensure estimates have sufficient reliability for their intended use • You can improve the reliability of estimates by aggregating geographies or subpopulations
Example of Aggregating Estimateshttp://www.census.gov/acs/www/data_documentation/documentation_main/http://www.census.gov/acs/www/guidance_for_data_users/handbooks/ Apply the formula: New Estimate = 23,001 (Equal to the sum of estimates) New Margin of Error = 3,046 (Less than the sum of MoE’s) The estimates in this example are fictitious.
All Data At Once,New Data Every Year Unlike Census 2000 which released data on a rolling basis, ACS is releasing data for all geographies at once Data are being released much quicker than Census 2000 data, within a year of the completion of data collection All geographies will now get new ACS data every year, rather than once a decade
Question and Answer Session Questions after the Webinar Contact Your Respective Liaisons