Download
1 / 21
210 likes | 636 Vues
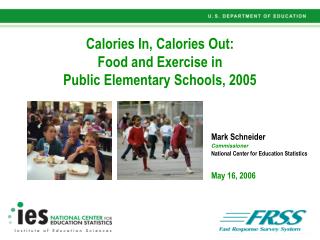
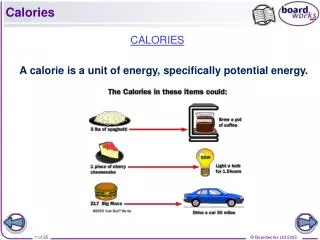
Calories In, Calories Out: Food and Exercise in Public Elementary Schools, 2005. Mark Schneider Commissioner National Center for Education Statistics May 16, 2006. Introduction.

E N D
Calories In, Calories Out:Food and Exercise inPublic Elementary Schools, 2005 Mark Schneider Commissioner National Center for Education Statistics May 16, 2006
Introduction • NCES releasing Calories In, Calories Out: Food and Exercise in Public Elementary Schools, 2005 on its website this morning • First U.S. Department of Education study to focus on food and exercise in public elementary schools • Prompted by concern about obesity among school-age children
Study obtained information on: • Calories in: • Availability of foods outside of full school meals • Calories out: • Opportunities for physical activity in school • Weighing students and notifying parents: • Extent to which schools weigh students, calculate body mass index, and report to parents
Study • Nationally representative sample of 1,198 regular public elementary schools • Conducted in spring 2005 through NCES’s Fast Response Survey System (FRSS) • Response rate of 91 percent
Figure 1a: Schools offering food for sale outside of full school meals SOURCE: U.S. Department of Education, National Center for Education Statistics, Fast Response Survey System (FRSS), “Foods and Physical Activity in Public Elementary Schools: 2005,” FRSS 87, 2005.
Figure 1b: Of schools that offered foods for sale outside of full school meals, percent that sold foods to generate funds for food service operations SOURCE: U.S. Department of Education, National Center for Education Statistics, Fast Response Survey System (FRSS), “Foods and Physical Activity in Public Elementary Schools: 2005,” FRSS 87, 2005.
Figure 2: Availability of vending machine foods and school store/snack bar foods NOTE: Vending machines and school stores/snack bars may or may not be located in the school cafeteria. SOURCE: U.S. Department of Education, National Center for Education Statistics, Fast Response Survey System (FRSS), “Foods and Physical Activity in Public Elementary Schools: 2005,” FRSS 87, 2005.
Figure 3: Contract with companies to sell drinks/snack foods, by school locale SOURCE: U.S. Department of Education, National Center for Education Statistics, Fast Response Survey System (FRSS), “Foods and Physical Activity in Public Elementary Schools: 2005,” FRSS 87, 2005.
Figure 4: Contract with companies to sell drinks/snack foods, by region SOURCE: U.S. Department of Education, National Center for Education Statistics, Fast Response Survey System (FRSS), “Foods and Physical Activity in Public Elementary Schools: 2005,” FRSS 87, 2005.
Figure 5: Contract with companies to sell drinks/snack foods, by percent minority enrollment SOURCE: U.S. Department of Education, National Center for Education Statistics, Fast Response Survey System (FRSS), “Foods and Physical Activity in Public Elementary Schools: 2005,” FRSS 87, 2005.
Figure 6: Schools with no scheduled recess, by grade level SOURCE: U.S. Department of Education, National Center for Education Statistics, Fast Response Survey System (FRSS), “Foods and Physical Activity in Public Elementary Schools: 2005,” FRSS 87, 2005.
Figure 7: Distribution of schools’ days per week of scheduled physical education, by grade level NOTE: One percent of the schools did not have any scheduled physical education for elementary grades (not shown in figure). Detail may not sum to totals because of rounding. SOURCE: U.S. Department of Education, National Center for Education Statistics, Fast Response Survey System (FRSS), “Foods and Physical Activity in Public Elementary Schools: 2005,” FRSS 87, 2005.
Differences by poverty concentration • The percent of students eligible for free or reduced-price lunch at the school was used as a proxy for poverty concentration. • High poverty schools (75-100% free or reduced-price lunch) were less likely to have any scheduled recess or daily recess, compared to schools with lower poverty concentrations. • When the times for physical education and recess were combined, high poverty schools had lower averages in minutes per week.
Figure 8: Grade 1—Time spent in recess and physical education, by poverty concentration SOURCE: U.S. Department of Education, National Center for Education Statistics, Fast Response Survey System (FRSS), “Foods and Physical Activity in Public Elementary Schools: 2005,” FRSS 87, 2005.
Figure 9: School programs to encourage physical activity SOURCE: U.S. Department of Education, National Center for Education Statistics, Fast Response Survey System (FRSS), “Foods and Physical Activity in Public Elementary Schools: 2005,” FRSS 87, 2005.
Figure 10: Extent schools calculated students’ BMI and measured height and weight NOTE: Detail may not sum to totals because of rounding. SOURCE: U.S. Department of Education, National Center for Education Statistics, Fast Response Survey System (FRSS), “Foods and Physical Activity in Public Elementary Schools: 2005,” FRSS 87, 2005.
Figure 11: Sent information on students’ BMI, height, and weight to parents SOURCE: U.S. Department of Education, National Center for Education Statistics, Fast Response Survey System (FRSS), “Foods and Physical Activity in Public Elementary Schools: 2005,” FRSS 87, 2005.
Availability of Report • http://nces.ed.gov • Print copies available from ED Pubs in June 2006 • Contacts for more information: Mike Bowler, IES Communications Director(202) 219 1662 mike.bowler@ed.gov Bernie Greene, FRSS Project Director(202) 502 7348 bernard.greene@ed.gov