Download
1 / 22
220 likes | 248 Vues
Settling Simulation of Muddy Lake to Identify Problematic Turbidity at the Intakes of a Reservoir. Frederick N.-F. Chou, Associate Professor Chia-wen Wu, Research Assistant. Department of Hydraulic and Ocean Engineering, National Cheng Kung University. Marko S.-H. Hsu , Professor.

E N D
Settling Simulation of Muddy Lake to Identify Problematic Turbidity at the Intakes of a Reservoir Frederick N.-F. Chou, Associate Professor Chia-wen Wu, Research Assistant Department of Hydraulic and Ocean Engineering, National Cheng Kung University Marko S.-H. Hsu, Professor Department of Water Resources Engineering and Conservation Feng Chia University
Enormous Sediments brought by Floodwaters afetr Devastating Jiji Earthquake, 2000 2. Many sediments have deposited on the river bed YuanShan Weir Shihmen Reservoir 4. Insufficient sluicewaycapacities of reservoirs 1. The devastating Jiji earthquake had caused large scale landslides and avalanches in the watersheds 3. Aggravating and more frequent flood threaten due to climate change Inflow of Shihmen Reservoir during Typhoon Aere with peak discharge as 8,000 cms
Flood-Induced Muddy Lake with High Turbidity of Stored Water • Shihmen Reservoir after Typhoon Aere (8/23~8/26, 2004)
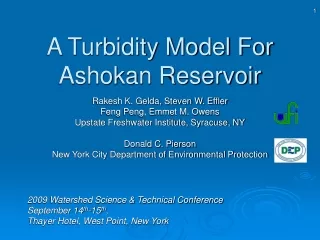
Turbidity Profiles in Shihmen Reservoir causing a 19-day urban water supply outage El.m Treatment threshold : 3000 NTU elevation of the original intake for public and agricultural water use Turbidity (NTU)
Emergency Water Supply and Reservoir Amelioration Build additional facilities for drawing the reservoir water Construct standby water storage pools and artificial lake Revamp the functions of existing desilting facilities of reservoir Water Supply Facilities Stabilization and Main Conveyance Pipeline Improvement Catchments Conservation and Management Shihmen Reservoir and its Catchment Management Project http://shihmen.wra.gov.tw/
Examining how settling of sediments in reservoirs affects post-typhoon public water withdrawal, by field measurement started after 8 days developing an experienced based 1-D model to approximately simulate the settling process of sediment flocs in a muddy lake after flood peak calibrating model according to the field data and from laboratory experiments difficult to efficiently, or may not be necessary to, simulate 2-D or 3-D models numerically Simulating the settling process of muddy storage in Shihmen Reservoir after the peak of Typhoon Aere to examine the reason of slow clarification to inspect the consequences of different reservoir operating strategies after typhoon for providing a reference when designing hydraulic flushing devices and backup water supply system Purpose of this Study
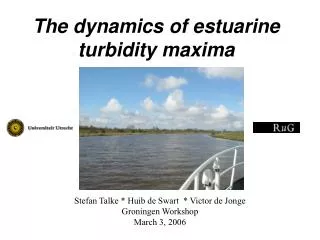
Delta, Turbidity Current and Muddy Lake Plunge Point Inflow with immense sediments Muddy lake by unvented turbidity current Delta Turbidity Current
Batch Settling(Diplas et al., J. Environ. Eng-ASCE, 1997) Mudline interface Sediment-suspension interface Constant rate settling 1st falling rate settling height 2nd falling rate settling Compression time t
1-D Settling Model of Cohesive Particles • Governing equation • Mass balance for water • Mass balance for sediment C:average volumetric sediment concentration A(z):the cross-sectional area of the vessel at height z (m2) vf、vs:velocities of the fluid and solid components in the mixture (m/day) qi、qo:the lateral inflow and outflow discharge within unit height (m2/day) Ci:volumetric sediment concentration of the lateral inflow
Kynch’s Theory (1953) • Assumptions • Solid particles are all small with respect to the container, and of the same size, shape and density • Incompressible • No mass transfer between components • Settling velocity is a function of the local concentration only • One-dimensional • the concentration of particles is constant at any cross-section of the vessel
Drift Flux Density Function • Combining the mass balance of water and sediments :drift flux density function (m/day)
Numerical Solving Process • Explicit upwind difference scheme (Bürger et al., 2004) • Initial condition • initial concentration is constant throughout the volume at t = 0 • Boundary condition • The surface concentration clarifies immediately as settling begins • The bottom of the vessel is a closed boundary ZL:the height of storage in the vessel
Parameterization of Settling Model(Coordinates of points in the fbk function) • fbk values between the pre-defined points • Cubic spline interpolation • Constraints of parameters (C10, b10) (C9, b9) (C1, b1) fbk(C) (C8, b8) (C7, b7) (C6, b6) (C5, b5) (C2, b2)~(C4, b4) Concentration (106 ppm)
Model Calibration Analysis • Gauss-Newton algorithm • minimizing deviation of simulated concentrations from the corresponding experimental values (Hsu et al, 2004) • initial concentrations of 20,000 and 70,000 ppm • applying a transformation procedure to convert the original parameters into unconstrained surrogate parameters • tractable by G-N algorithm • Chou and Wu, Advances in Water Resources, 33(2), 2010 field slurry sampled from Shihmen Reservoir
Simulation using the Calibrated fbk Function • 70,000 ppm initial concentration case Coefficient of efficiency between the observed and simulated concentration profiles RMSE between the observed and simulated concentration profiles
Case Study To the confluence of Tamshui River Taoyuan Irrigation Association Area Danan Treatment Plant Houchun Weir Panhsin Water Treatment Plant Shihmen Treatment Plant Yuanshan Weir Shanshia Pumping Station Pinchen Treatment Plant Shinmen Irrigation Association Area Longtang Treatment Plant Shanshia River Afterbay Weir Shihmen Reservoir : 219 × 106 m3 Upstream Tahan River
Intake works of the Shihmen Reservoir Top of Dam: El. 252.1 m Elevation (m) Tunnel Spillway: El. 220 m Shihmen Canal Intake: El 195 m Hydro Plant Intake: El 173 m P.RO. Intake: El 169.5 m P.RO. Outlet: El 140 m
Simulating the Turbidity Profile of Shihmen Reservoir after Typhoon Aere • from August 26 to September 11 in 2004 • Initial concentration:25,000 ppm • from the turbidity data observed by a nearby treatment plant • The concentration of recession inflow was assumed to be 0 • 2 scenarios • I:using historical releasing record of each outlet • II:adding a recently constructed sluiceway (300 cms) • sluiceway sluices the bottom mud for the first 3 days following the peak • The hydropower plant releases turbid water since the storage is greater than the upper limit of the operating rule curve of Shihmen Reservoir. • The tunnel spillway vents excess inflow to assist desiltation.
Simulated Clear-Muddy Interface in the Storage (take threshold as 3,000 NTU) Simulated Interface of Scenario I Simulated Interface of scenario II Elevations of turbidity measurements with numbers as turbidities in NTU unit El. 236 El. 228 El. 220 Elevation of Shihmen Canal’s Intake
A backup storage pond will be urgently necessary for first 4 days for maintaining stable public water supply in this area. Simulated Outflow Turbidity of Reservoir Measured streamflow turbidity in YuanShan Weir Simulated turbidity of Shihmen Reservoir’s outflow using historical operating strategy Simulated turbidity of Shihmen Reservoir’s outflow discharge using hypothetic flushing strategy 3,000 NTU
A unidimensional settling model was proposed calibrated with laboratory experiment data to quantify the level and impacts of high turbidity in reservoir A historical water shortage event was investigated confirms the effectiveness of accelerating settling by sluicing bottom storage through the sluiceway. a backup storage tank will be urgently necessary Simulating errors come from invalidation of model assumptions the unrepresentative errors of the calibrated experienced parameters To improve the prediction accuracy adopt recursive updating mechanisms based on the measurement feedback from real-time monitoring system utilize any other state-of-the-art sediment routing models to acquire the concentration profile for the initial condition of settling analysis Conclusions and Suggestions
END Comments & Suggestion