Download
1 / 7
100 likes | 240 Vues
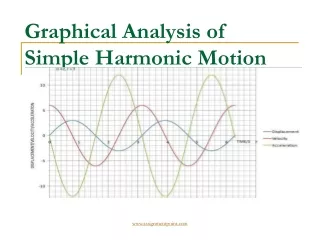
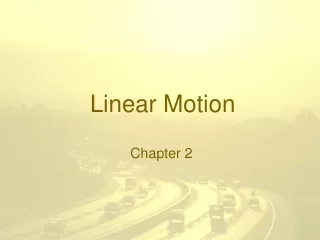
2-8 Graphical Analysis of Linear Motion. This is a graph of x vs. t for an object moving with constant velocity. The velocity is the slope of the x-t curve. 2-8 Graphical Analysis of Linear Motion.

E N D
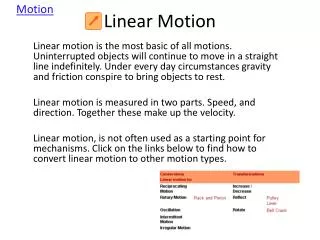
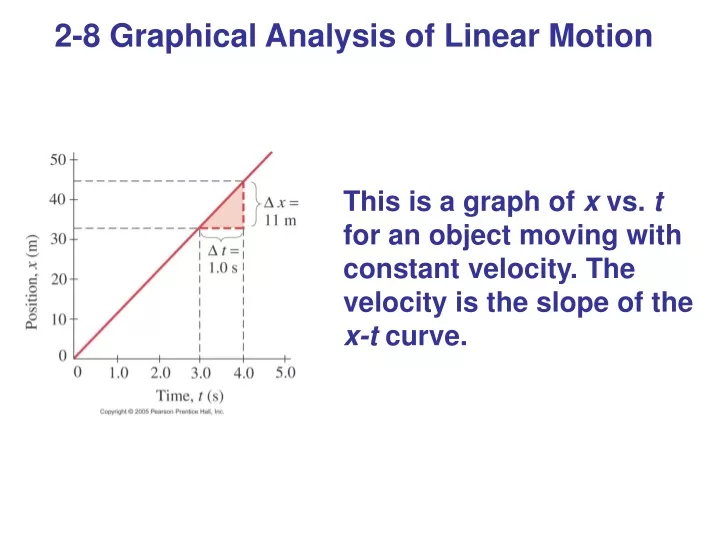
2-8 Graphical Analysis of Linear Motion This is a graph of x vs. t for an object moving with constant velocity. The velocity is the slope of the x-t curve.
2-8 Graphical Analysis of Linear Motion On the left we have a graph of velocity vs. time for an object with varying velocity; on the right we have the resulting x vs. t curve. The instantaneous velocity is tangent to the curve at each point.
2-8 Graphical Analysis of Linear Motion The displacement, x, is the area beneath the v vs. t curve.
4 3 2 1 0 10 2 4 8 6 -1 -2 -3 -4 x (m) t (sec) From 0 to 2 seconds slope = 0 object not moving - at rest From 2 to 4 seconds positive/constant slope constant velocity moving in positive direction v = (3 - 0) / (4 - 2) = 1.5 m/s From 4 to 6 seconds slope = 0 object not moving - at rest From 6 to 10 seconds negative/constant slope constant velocity moving in negative direction v = (-2-3 ) / (10 - 6) = -1.3 m/s
x x (m) (m) t t (s) (s) v v (m/s) (m/s) t t (s) (s) distance vs time graph constant velocity position changes over time at a constant rate constant position no change in position zero velocity velocity vs time graph constant acceleration velocity changes over time at a constant rate constant velocity no change in velocity zero acceleration
velocity/time graph Total Distance 230 m Total Time 50 seconds Average Velocity 4.6 m/s 10 8 II v (m/s) constant acceleration III 6 constant I deceleration constant velocity IV 4 V0 = 4 m/s Vf = 10 m/s a = 0.6 m/s2 t = 10 seconds x = 70 m V0 = 4 m/s Vf = 4 m/s a = 0 t = 20 seconds x = 80 m constant velocity V0 = 10 m/s Vf = 2 m/s a = 0.8 m/s2 t = 10 seconds x = 60 m 2 V0 = Vf = 2 m/s a = 0 t = 10 seconds x = 20 m 0 50 20 40 10 30 t (sec)
10 velocity/time graph 8 I. Velocity is constant at 4 m/s Acceleration is 0 Time = 20 seconds Distance = 80 meters x = 80 m x=vt 4(20)=80 m v (m/s) constant acceleration 6 constant deceleration constant velocity 4 II III constant velocity 2 I IV 0 50 10 20 30 40 III. t (sec) Acceleration is constant deceleration at 0.8 m/s2 Velocity is changing Time = 10 seconds Distance = 60 meters Vf = 2 m/s Vi = 10 m/s t = t4 - t3 t = 40 - 30 = 10 sec a = (Vf - Vi)/t a = (2 - 10)/10 = -0.8 m/s2 (deceleration) x = vt x = (10+2) (10) = 60m 2 II. Acceleration is constant at 0.6 m/s2 Velocity is changing Time = 10 seconds Distance = 70 meters Vf = 10 m/s Vi = 4 m/s t = t3 - t2 t = 30 - 20 = 10 sec a = (Vf - Vi)/t a = (10 - 4)/10 = 0.6 m/s2 x = vt x = (10+4) (10) = 70m 2 IV. Velocity is constant at 2 m/s Acceleration is 0 Time = 10 seconds Distance = 20 meters t = t5 - t4 t = 50 - 40 = 10 sec x = 20 m x=vt 2(10)=20 m Total Distance 230 meters (80+70+60+20) Total Time 50 seconds Average Velocity 4.6 m/s (230/50)